What Is a Skill Graph?
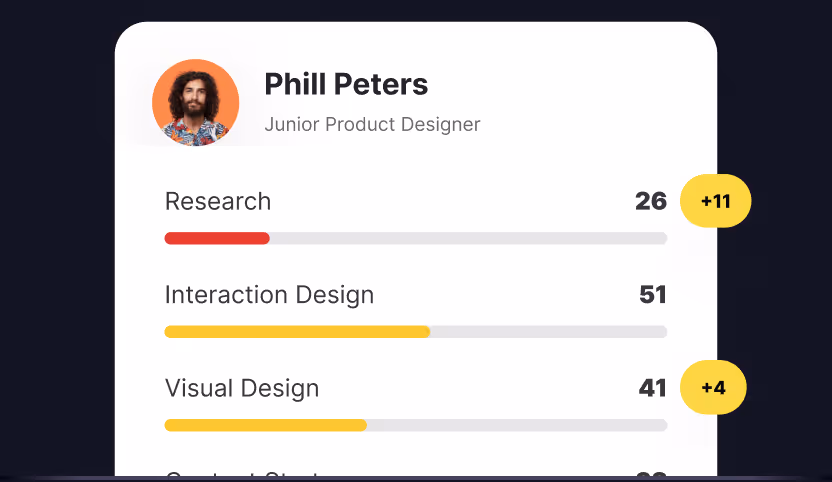
A skill graph is a visual map of strengths across key UX design skills and product manager skills, but getting detailed, accurate skill insights has long been a challenge for hiring managers, team leads, and professionals themselves. Quantifying design skills was nearly impossible, and comparing one designer’s skill set to another’s was time-consuming if it was even possible. This is why Uxcel has released Skill Graph, a detailed way to figure out where a designer’s strengths really lie.
Skill Graphs have been part of the Uxcel profile for a while. But there were limitations to how they were created. The biggest was that there was only a limited set of data points available for each designer because the Verified Designer skill test only included 40 questions from a pool of hundreds. And because of the nature of how questions were included in the test, not every designer would be tested on every skill. That could leave big gaps in how a designer’s skill set was displayed and didn’t always give the most accurate picture.
Skill Graph solves this issue with the Pulse assessment, which evaluates your skills across key areas of professional knowledge. The Pulse assessment ensures you’re tested on the skills that matter most in each of these key areas — the same competencies covered in our UX UI design certification track.
Skill Graph Assessment: What Makes Uxcel’s Different
Skill Graphs give anyone looking at a designer’s Uxcel profile an immediate, visual indication of where that designer’s skills are strongest. This is critical when making hiring decisions, as you need to know that the designer you’re considering has the skills your company and current team need most. It’s also incredibly useful for team leads who are trying to figure out where the gaps are among their team members, and whether it’s better to enroll their team in UX design training or hire a new team member to fill those gaps.
We’ve spent months researching which skills are vital to becoming an expert in your field. Some basic skills were obvious right away — things like typography, color theory, principles of UX, and principles of design. But we wanted to go deeper than that to create a well-rounded picture of what it means to be an expert in your discipline. We finally landed on 6 categories of skills for each path that the best professionals possess, including soft skills.
The Skill Graph covers 6 main categories for each path. For UX designers: User Research, Visual Design, Interaction Design, Content Strategy, Design Leadership, and Product Thinking. For product managers: Business Strategy, Product Development, Stakeholder Management, Product Leadership, Technical Proficiency, and Data Analytics. The Skill Graph shows how strong you are in each of these areas, creating a full picture of what you have to offer.
Skill Graph Training: UX Design & Product Manager Assessment Categories
The Pulse assessment gives a solid picture of your strengths and areas for improvement. Each Skill Graph area was chosen based on the qualities and expertise necessary for a successful career in UX design or product management.
UX Designer Skill Graph
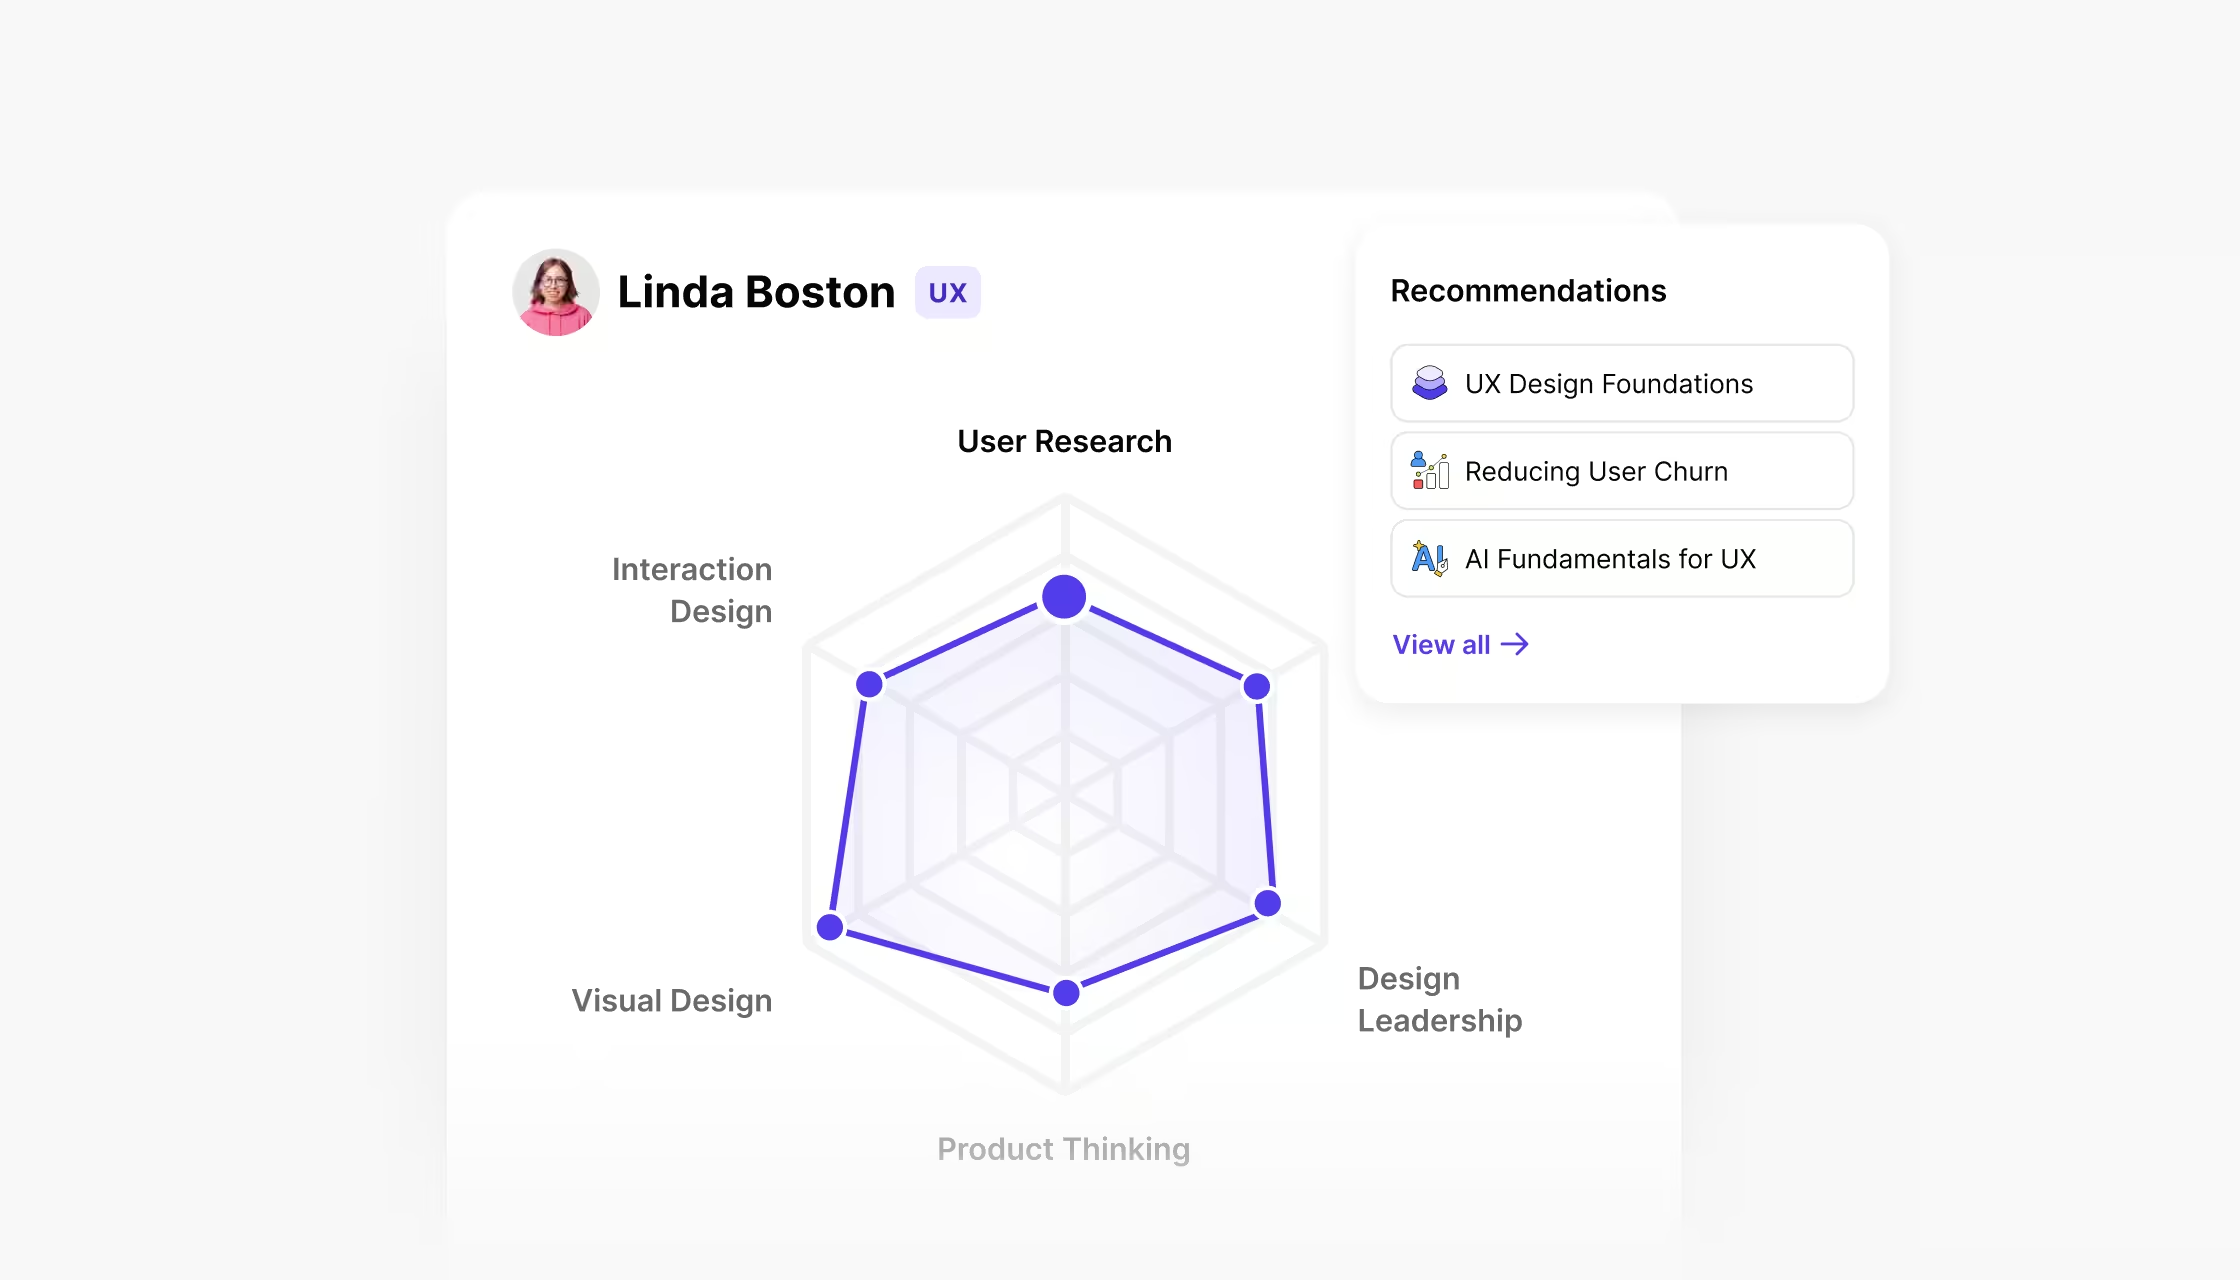
The UX Designer Skill Graph maps your proficiency across 6 core design competencies — a snapshot of your UX UI design professional path. After completing the Pulse assessment on the UX path, your graph reflects how you perform in each of these areas.
User Research
Understanding what users need and how they behave is foundational to good design. This category covers general UX research methods, qualitative and quantitative data analysis, and user testing, helping designers make informed decisions backed by real insights.
Visual Design
This category evaluates your ability to use typography, color, icons, illustrations, layout, and UI components to create interfaces that are visually engaging, meaningful, and accessible — fundamentals taught in our design foundations curriculum.
Interaction Design
How a product looks is only part of the equation. This category focuses on how designs work, covering the principles and patterns that shape usable, intuitive interactions.
Content Strategy
Strong content is the backbone of a useful product. This category covers information architecture, UX writing, content branding, and content design, all essential for creating experiences that communicate clearly.
Design Leadership
Whether or not you’re in a leadership role, understanding how to guide teams, mentor designers, and make strategic decisions is valuable. This category assesses leadership qualities that contribute to well-rounded, effective design teams — qualities deepened through our design team leadership course.
Product Thinking
Great designers think beyond pixels. This category evaluates your ability to connect design decisions to broader product goals, business outcomes, and user value.
Product Manager Skill Graph
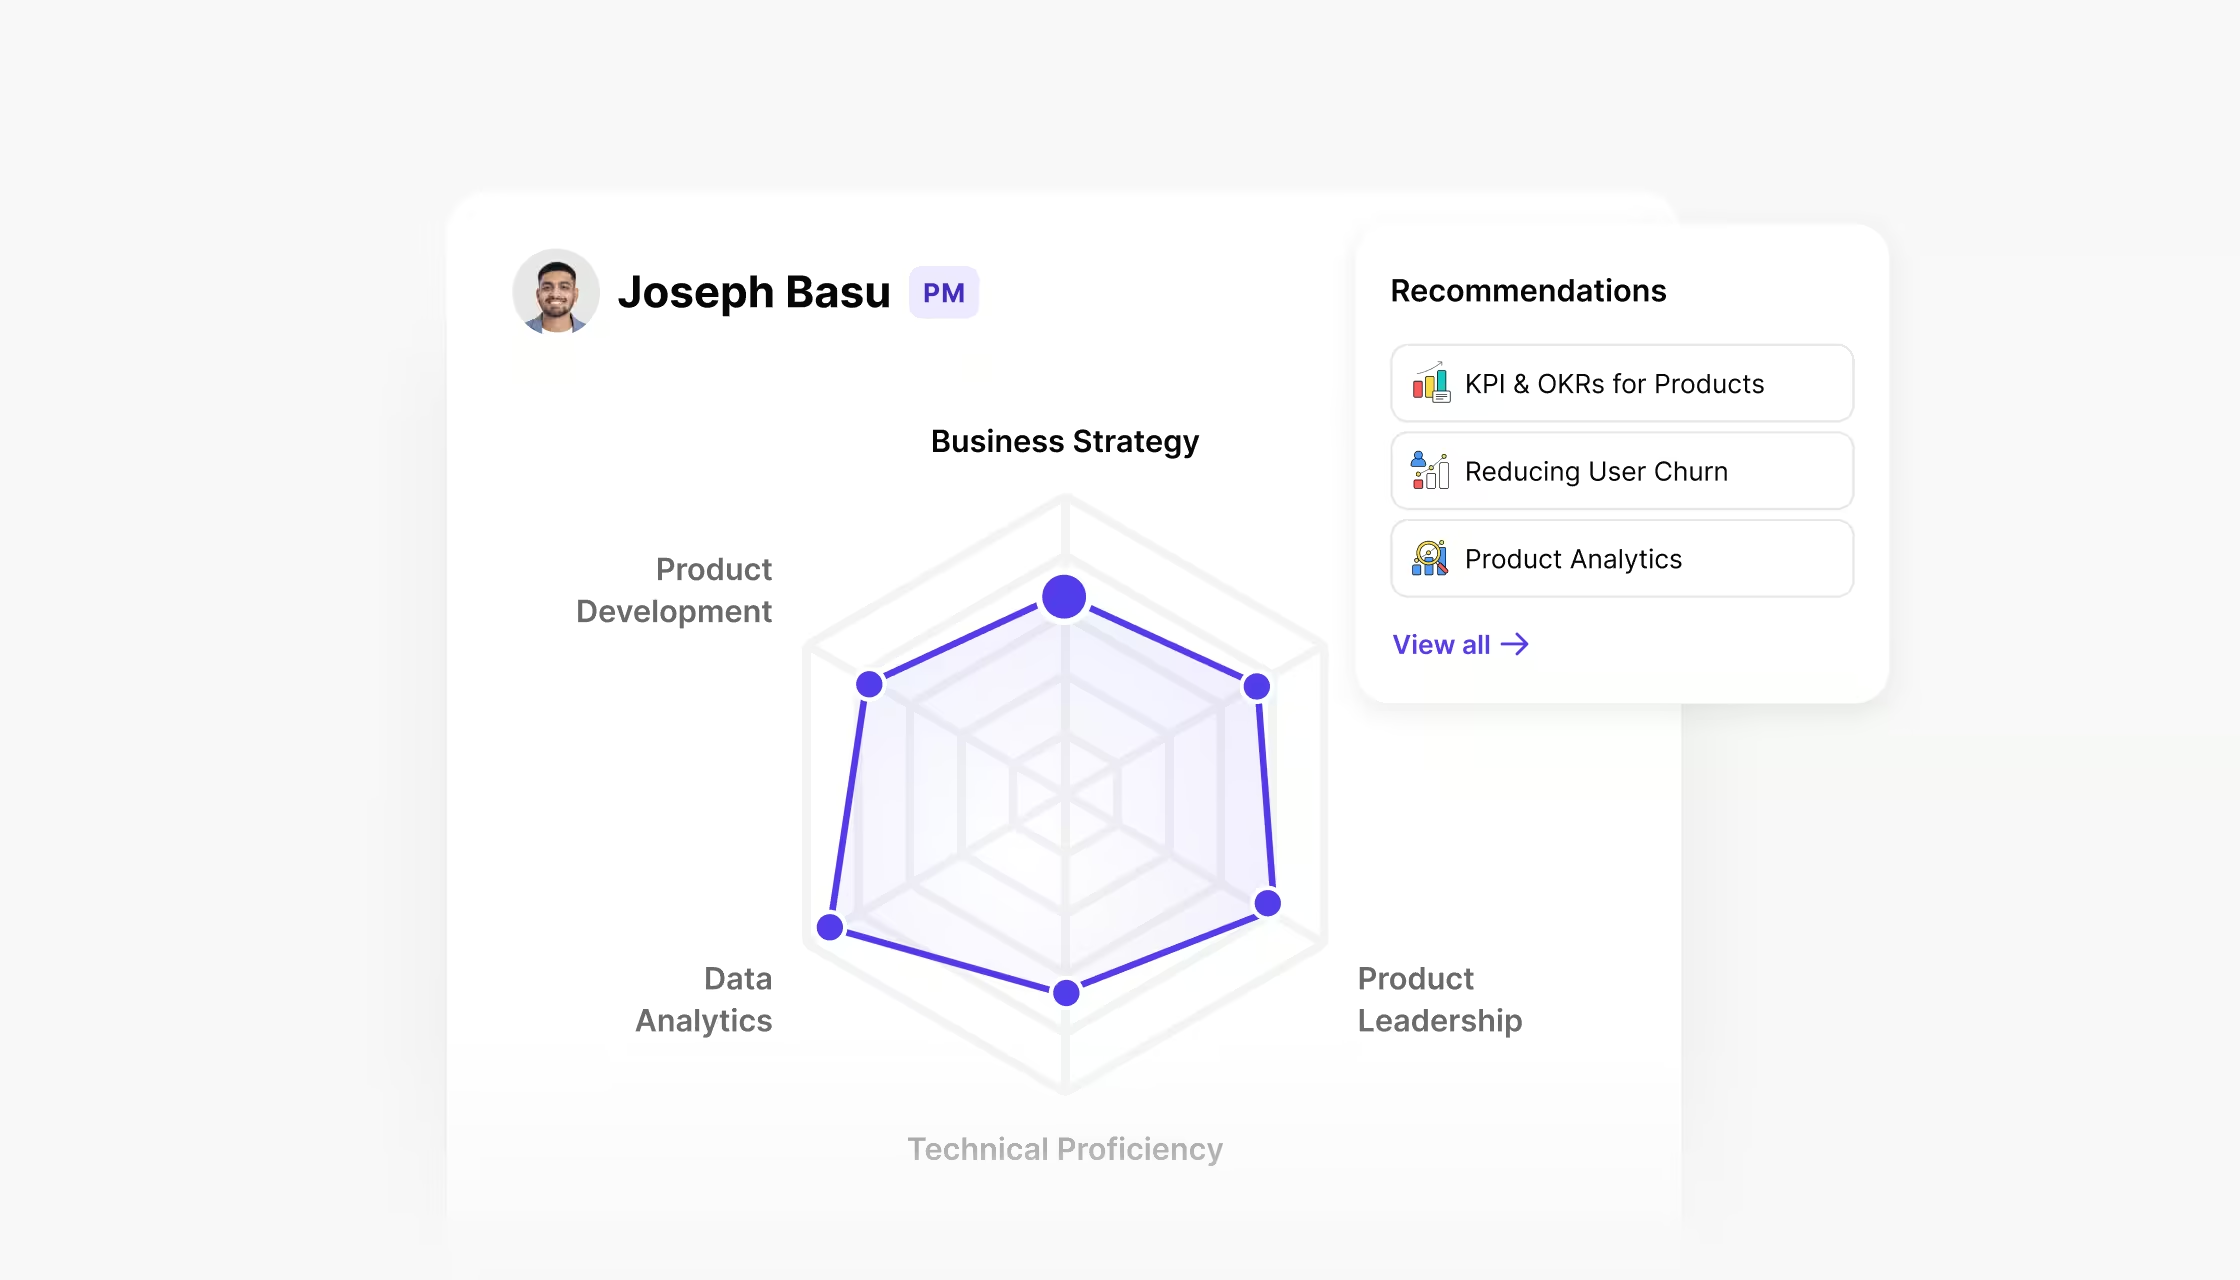
The Product Manager Skill Graph maps your proficiency across 6 core PM competencies. After completing the Pulse assessment on the PM path, your graph reflects how you perform in each of these areas.
Business Strategy
This category covers your ability to align product decisions with business goals, market positioning, and competitive analysis. It evaluates how well you connect product work to organizational outcomes.
Product Development
From roadmapping to feature prioritization, this category assesses your understanding of the product development lifecycle and your ability to move ideas from concept to launch.
Stakeholder Management
Building alignment across teams, leadership, and external partners is a core PM skill. This category evaluates how effectively you communicate, negotiate, and manage competing priorities.
Product Leadership
This category focuses on your ability to set product vision, guide cross-functional teams, and make strategic decisions that shape the direction of a product.
Technical Proficiency
PMs don’t need to write code, but they do need to understand technical concepts. This category assesses your comfort with engineering workflows, system architecture, and technical trade-offs.
Data Analytics
Data-driven decision-making is essential for modern product management. This category covers your ability to interpret metrics, run experiments, and use data to inform product strategy.
How the Skill Graph Helps You Grow
Uxcel’s Skill Graph allows professionals to see concise benchmarks against other professionals around the world by role and years of experience. It also allows you to see where you have room for improvement, complete with learning recommendations. Uxcel for Teams brings the same view to managers tracking entire design groups. It supports broader strategies for nurturing design talent at scale.
For professionals looking to get hired, the Skill Graph provides insights to recruiters on where their strengths lie and what type of role they’d be best suited for. And it gives you an idea of where you could strengthen your skills to get better opportunities.
Team leads and educators can see where their team members have room for improvement, as well as where their team members’ strengths lie. This is an invaluable resource for teams who need to know exactly which skills they need to bolster, or where new hires might be appropriate.