

What is A/B testing?
A/B testing is an experiment that compares two versions of something, a webpage, an interface component, a copy variation, a feature flow, against each other by exposing one version to half the user population and the other version to the other half, then measuring which version better achieves a specified goal.
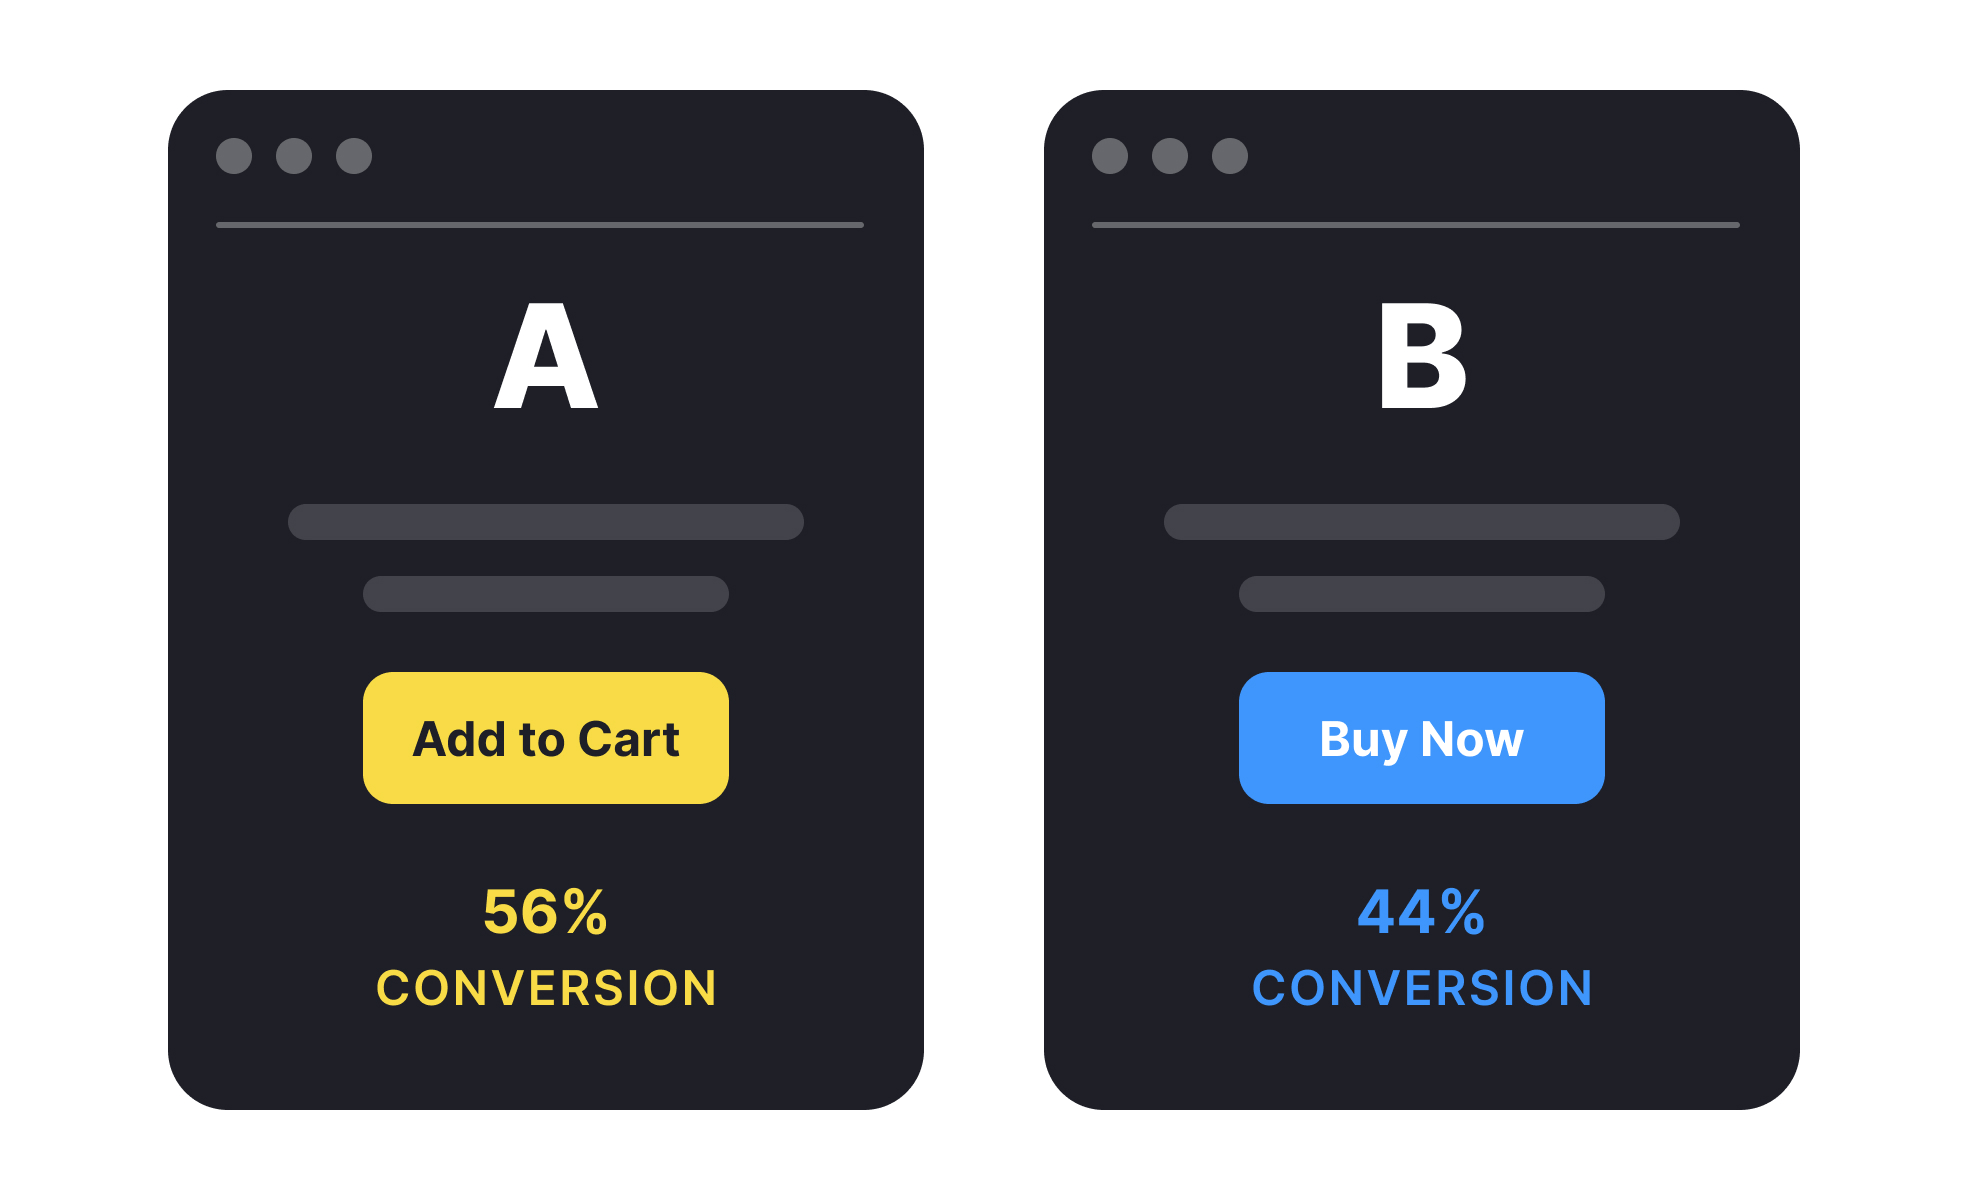
The two versions are typically called A (the control, which is usually the current version) and B (the variant, which is the proposed change). Users are randomly assigned to one group or the other, and the assignment is maintained throughout the experiment so each user consistently experiences the same version. At the end of the experiment, the metric of interest is compared between groups. If the difference is statistically significant, the team can attribute it to the change rather than to random variation.
A/B testing answers a specific and important question: when we change X, does user behavior on metric Y improve? It doesn't tell you why users behave differently, or what they think about the change. That's the role of qualitative research. A/B testing and user research are complementary, not substitutes for each other.
What types of changes are typically A/B tested?
A/B testing can be applied to almost any variable in a digital product, but some categories are more commonly tested than others.
- Copy and messaging variations test whether different words produce different behavior. Button labels ("Sign up" vs. "Get started"), headline copy, value proposition statements, and call-to-action phrasing are among the most frequently tested copy elements. These tests are often cheap to implement and can produce significant conversion differences.
- Visual and layout changes test how design modifications affect behavior. This includes button color, positioning of key elements, the presence or absence of visual elements like images or trust signals, page layout, and the visual hierarchy of information. The Microsoft Bing case, where a layout change to search results generated $100 million in additional annual revenue, is a well-known example of the potential impact of seemingly minor visual changes.
- Flow and navigation changes test whether different task structures produce better completion rates. Reducing the number of steps in a checkout flow, changing the order of onboarding questions, or simplifying a registration form are common flow tests.
- Feature flags and rollouts use A/B testing to expose new features to a subset of users before full release. This validates that new functionality improves the intended metric before committing to shipping it to all users, and it limits the blast radius if the new feature performs unexpectedly.
What does statistical significance mean in A/B testing?
Statistical significance is the concept that determines whether an observed difference between the A and B groups is likely to be real, or whether it could have occurred by chance even if the two versions were actually equivalent.
The standard threshold in most A/B testing contexts is p < 0.05, meaning there's less than a 5% probability that the observed difference occurred by chance if there were actually no real effect. When a test reaches this threshold, it's said to be statistically significant at the 95% confidence level. Some teams use 99% confidence (p < 0.01) for higher-stakes decisions.
Statistical significance says nothing about the size of the effect. A test can be statistically significant with a very small, practically irrelevant difference if the sample size is large enough. Practical significance, whether the difference matters enough to justify acting on it, is a separate judgment.
Sample size determines how quickly a test reaches statistical significance. Small traffic volumes make it harder to reach significance: the test needs to run longer, or the true effect needs to be larger, to be detectable. Sample size calculators (provided by most A/B testing platforms) help teams estimate how long a test needs to run before drawing conclusions, given expected traffic and expected effect size.
A common mistake is stopping a test as soon as it appears to reach significance, a practice called peeking. Because statistical calculations are designed for a single evaluation at a predetermined sample size, checking results during the test and stopping when significance is reached inflates the false positive rate significantly. Tests should be designed with a target sample size and run to completion before results are evaluated.
How does A/B testing fit into a broader research practice?
A/B testing is one tool in a broader toolkit, and its scope and limitations should be clearly understood.
A/B testing excels at measuring behavioral outcomes at scale. It tells you definitively whether a change produced a difference in measurable behavior. It doesn't tell you why, what users thought about the change, or whether the change had effects on dimensions you didn't measure. A test that increases checkout conversion might simultaneously decrease customer satisfaction or brand perception in ways that hurt long-term retention.
User research, including usability testing, interviews, and surveys, provides the qualitative context that explains what A/B testing measures. When a B variant underperforms, research helps diagnose why. When teams want to understand which of several directions to test, research can narrow the options before expensive development of test variants.
Analytics provides the continuous behavioral data from which hypotheses for A/B tests emerge. Identifying where users drop off in a flow, which features have lower engagement than expected, or which pages have high bounce rates points toward the questions worth testing. The most effective teams run A/B testing as part of a continuous experimentation culture rather than as an occasional special project. Teams at companies like Amazon, Netflix, and Google run thousands of A/B tests simultaneously, and the compound effect of small improvements across many decisions is significant.


