


Most design work is still judged in review meetings, where the strongest preference in the room wins; metrics are how a team replaces that with a comparison. The vocabulary has spread far beyond research teams because product managers, analytics platforms, and executive dashboards now all ask what a design change did. A number only counts as a design metric when it is tied to a decision and measured against a baseline, and many of the numbers in circulation fail one of those two tests.
In this glossary topic:
- What are UX and design metrics?
- What are the main families of design metrics?
- How does the HEART framework organize design metrics?
- How are design metrics collected?
- How do design metrics differ from KPIs and analytics tools?
- What are the limits of design metrics?
- What do design metrics look like in practice?
- What do design metrics mean for designers and product managers?
- FAQ

What are UX and design metrics?
UX and design metrics are quantitative measures of how well a design performs for the people using it: whether they can complete what they came to do, how long it takes, how often they go wrong, and how they feel about it afterward. They sit apart from measures of the business, such as revenue, and of the system, such as uptime, because the unit of observation is a person using an interface.
The point of a design metric is to turn a judgment into a comparison. "The checkout feels clunky" is an opinion; the share of participants who completed checkout without help, this version against the last, is evidence. A design metric earns its place by being attached to a specific design decision, not by being easy to count.
What are the main families of design metrics?
Behavioral metrics record what people did. Task success rate is the share of attempts that ended in the intended outcome, scored as a pass or fail per task. Time on task is how long a completed attempt took. Error rate counts wrong turns and invalid entries per task, and navigation efficiency compares the path taken with the shortest one available. Completion rate, the share of people who got from the first step of a flow to the last, is the analytics cousin of task success.
Attitudinal metrics record what people reported. The System Usability Scale (SUS) is a ten-statement questionnaire that produces a score from 0 to 100; Customer Satisfaction Score (CSAT) asks how satisfied someone was with a specific interaction; and Net Promoter Score asks about willingness to recommend, a loyalty measure that design only partly controls.
Outcome-linked metrics record what the design did for the business: conversion on a redesigned flow, retention after an onboarding change, or support contacts about a screen before and after a rebuild. Behavior and attitude regularly disagree, which is why a serious measurement plan pairs one metric from each family rather than trusting either on its own.
How does the HEART framework organize design metrics?
Google's HEART framework groups user experience metrics under five headings: happiness (attitude, measured by surveys), engagement (depth and frequency of use), adoption (new users taking up a feature), retention (existing users still present after a period), and task success (effectiveness, efficiency, and errors on specific tasks). Researchers at Google published it in 2010 to bring the metrics of large-scale products into one vocabulary.
The more durable part of HEART is the goals, signals, and metrics process that comes with it. A team states what a design should achieve, names the behaviors or attitudes that would signal it, and only then picks a metric for each signal. Starting from the goal rather than the dashboard is what keeps a metric honest, because it asks what would change if the design worked before anyone looks at what the analytics tool already counts. Few products need all five categories at once.
How are design metrics collected?
Each family has a home method. Task metrics come from moderated or unmoderated usability testing, where participants attempt defined tasks and each attempt is scored for success, time, and errors. Attitudinal metrics come from questionnaires, administered after a test session, inside the product, or by email to a sample of users. Behavioral metrics at scale come from product analytics, where instrumented events record completion and drop-off across everyone rather than a recruited few. The Quantitative UX Research Methods lesson covers how each method produces numbers and what sample it needs.
The methods trade breadth against depth. A usability test with a dozen participants shows precisely where a task breaks but gives a wide margin on any percentage; analytics gives a narrow margin and no picture of why. The sample size has to match the claim being made: a task success figure from eight sessions can say a problem exists, not that it affects a third of users. Benchmark studies, which rerun the same tasks on each release, are how teams get metrics stable enough to track over time.
How do design metrics differ from KPIs and analytics tools?
A KPI is a target the business has committed to, such as revenue, active accounts, or cost per acquisition, and it moves for many reasons at once: pricing, marketing, seasonality, and the design. A design metric is evidence about one interaction. Task success on the new sign-up form is a design metric; monthly sign-ups is a KPI the form contributes to.
The two are linked, not interchangeable. A design metric is often the leading indicator for a KPI, the number that moves first and explains part of what the KPI does later. Reporting a design change against the KPI alone invites credit for an uptick that marketing caused, or blame for a dip that pricing caused.
Analytics tools are the instruments, not the metrics. A platform reports whatever events were defined for it, so it can produce a completion rate but cannot say whether the rate reflects a good design or a tracking gap. The metric is a decision about what to count; the tool is where the count is kept, and the Product Metrics & KPIs lesson works through choosing the former before configuring the latter.
What are the limits of design metrics?
Three failures recur. The first is a metric without a baseline: a task success rate means nothing on its own, because the question is always whether the number moved. The second is the average that hides the people who struggled. A mean time on task of forty seconds can combine most people finishing in twenty with a minority stuck for two minutes, and the minority is where the design problem lives, so distributions and segment splits matter more than the headline figure.
The third is measuring what is easy to instrument. Clicks, page views, and session length are always available; whether a person understood what they read, or trusted what they saw, is not, and a team that reports only what the tooling emits tunes the measurable parts while the rest drifts. Every metric is a proxy, and the proxy can improve without the experience improving: a shorter time on task can mean a clearer flow or a person giving up faster.
What do design metrics look like in practice?
The most recognizable artifact is the HEART row itself: five categories a team walks across before it picks a single number, asking for each whether the design is meant to move it. Walking the row forces each metric to justify its presence by naming the goal it serves, which is the discipline most dashboards lack.
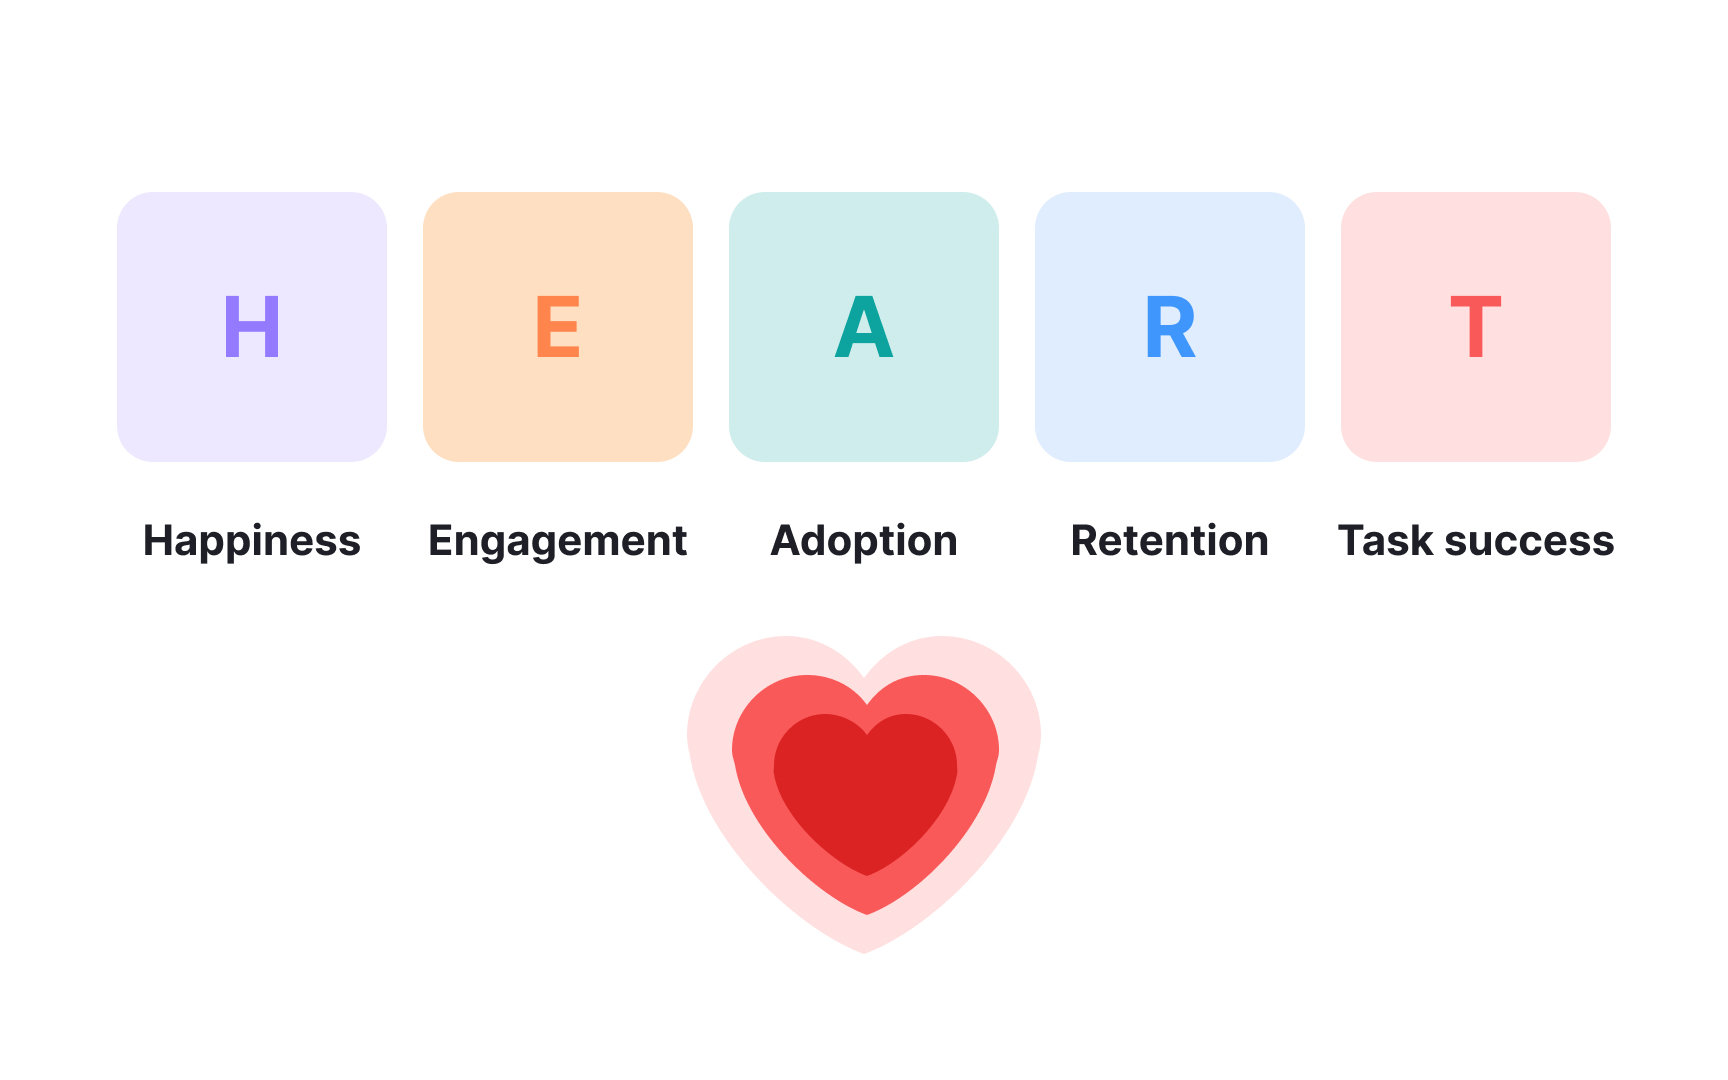
The five HEART categories side by side: happiness and task success are the ones closest to individual design decisions, while engagement, adoption, and retention describe how a product is used over time. From the lesson Product Management Terms for Growth Frameworks & Strategy.
What do design metrics mean for designers and product managers?
For a designer, the habit that matters is choosing one or two metrics per design decision and agreeing them before the work begins. A redesign of the filters on a search page has a natural metric, the share of searches that end in a result being opened, and a natural baseline, the same figure on the current page. Agreeing both in advance removes the temptation to pick, after launch, whichever number moved.
For a product manager, design metrics are the layer between the roadmap and the outcomes it promised. An onboarding rebuild is sold on retention rate, which takes months to read; task success on the new flow is readable in the first week. A design change reported without its baseline is a story, not a result, and the baseline has to be measured on the old design before it disappears. Picture a team that ships a new pricing page, watches the conversion rate climb, and only then asks what the old page's rate was.


