Quantitative UX research collects numerical data about how users interact with a product. It answers questions like how many, how often, and how long, providing evidence that is easy to compare, track over time, and present to stakeholders. While qualitative methods reveal why users behave a certain way, quantitative methods show the scale and consistency of that behavior across larger groups.
Some designers treat quantitative methods as too complex or too removed from the user experience. That hesitation is worth examining. A/B tests, surveys, SUS scores, and web analytics do require more setup than a handful of interviews, but they produce findings that qualitative research alone cannot. They can confirm whether a usability improvement made a measurable difference, reveal drop-off points across thousands of sessions, or benchmark a product against an earlier version.
Quantitative and qualitative methods are most powerful in combination. Numbers raise the questions that interviews answer, and interview findings suggest the hypotheses that data can confirm. This lesson covers the core quantitative methods used in UX research and when each one is the right fit.
A/B testing
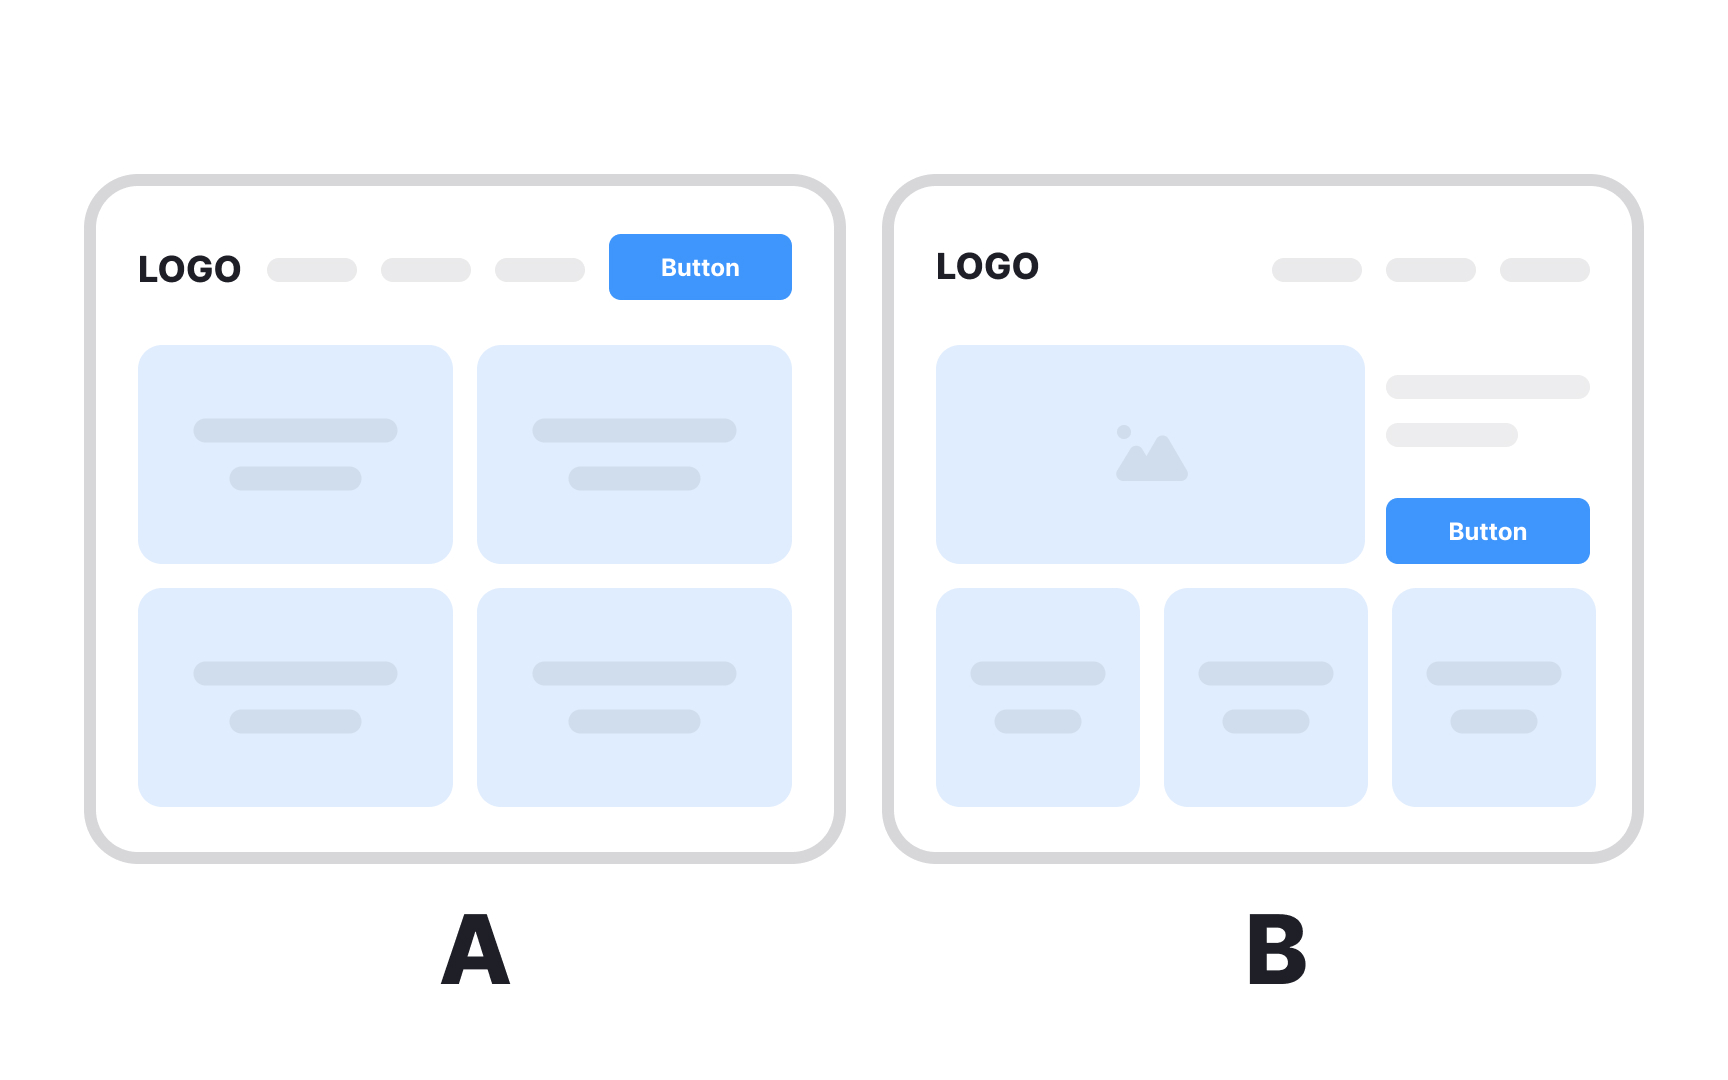
A/B testing is a quantitative research method that measures how different UI designs affect product performance. Designers create two versions of the same interface and expose each to a separate group of users to determine which performs better against a defined metric.
To run a valid test, 3 things need to be in place:
- Choose a variable to test: a CTA label, a hero image, button placement, or another element with potential to drive meaningful change.
- Define a single goal and form a hypothesis around it. Testing against one metric keeps results clean and actionable.
- Split your audience equally and randomly. Segmenting by demographics like gender or age introduces bias and dilutes the insight you're looking for.
When testing several design elements at once, such as typefaces, button placement, and icons, the method is called multivariate testing. It follows the same logic as A/B testing but captures how combinations of variables interact rather than isolating a single change.
A/B testing is cost-effective and straightforward to run. It's particularly useful for resolving disagreements within teams, because the outcome is based on user behavior rather than opinion.[1]
A/B testing is often confused with preference testing, but they measure different things. Preference testing asks users which design they like and why. A/B testing skips opinion entirely and measures what users actually do. What people say they prefer and what they perform best with are often not the same thing.
Pro Tip! Make sure to run the tests long enough to produce useful data. It’ll prevent your team from making rash decisions based on small numbers.
Eye tracking
Eye tracking is a quantitative research method that uses specialized equipment to record where users look as they navigate an interface. It captures:
- Fixations where the gaze rests
- Saccades — rapid movements between fixations
- Overall scan path reveals which elements attract attention and which go unnoticed.
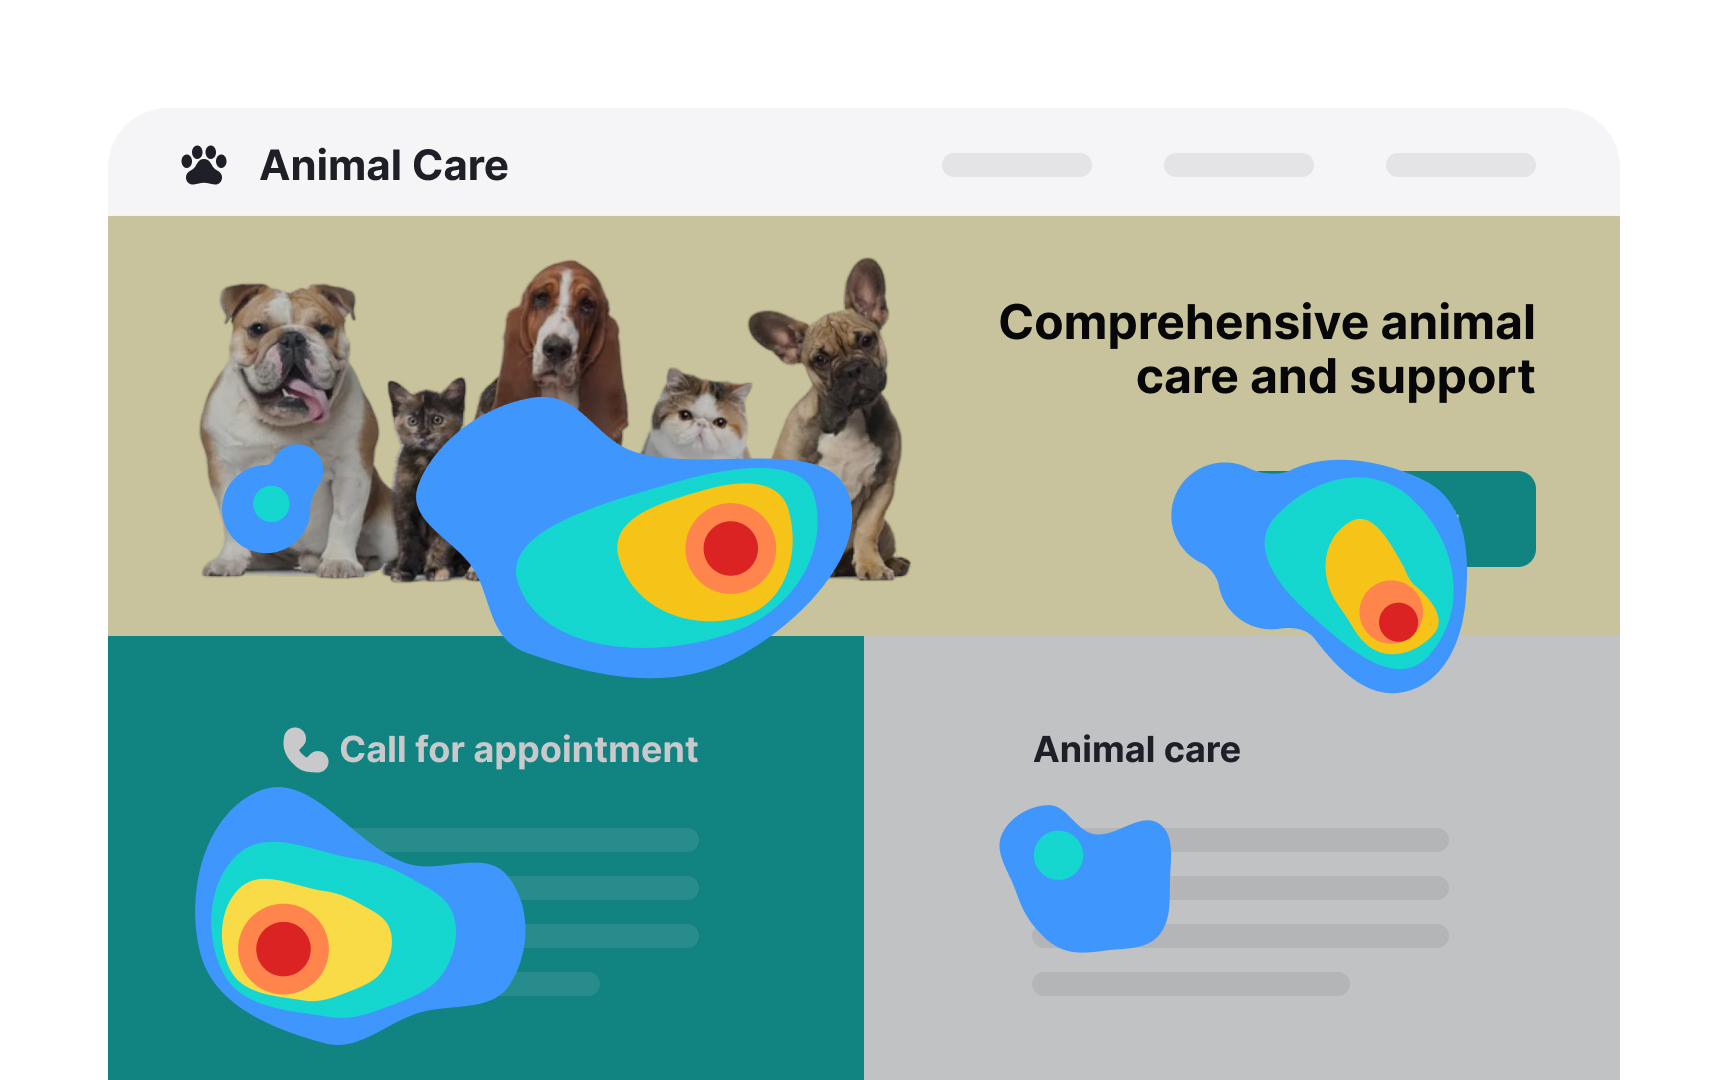
The most common output is a heatmap, an aggregate visualization showing which areas of a page received the most visual attention across participants. Heatmaps require a large sample to be reliable, like 30-40 participants. For smaller studies, researchers analyze individual session replays, which offer richer qualitative insight into how each participant processed the interface.
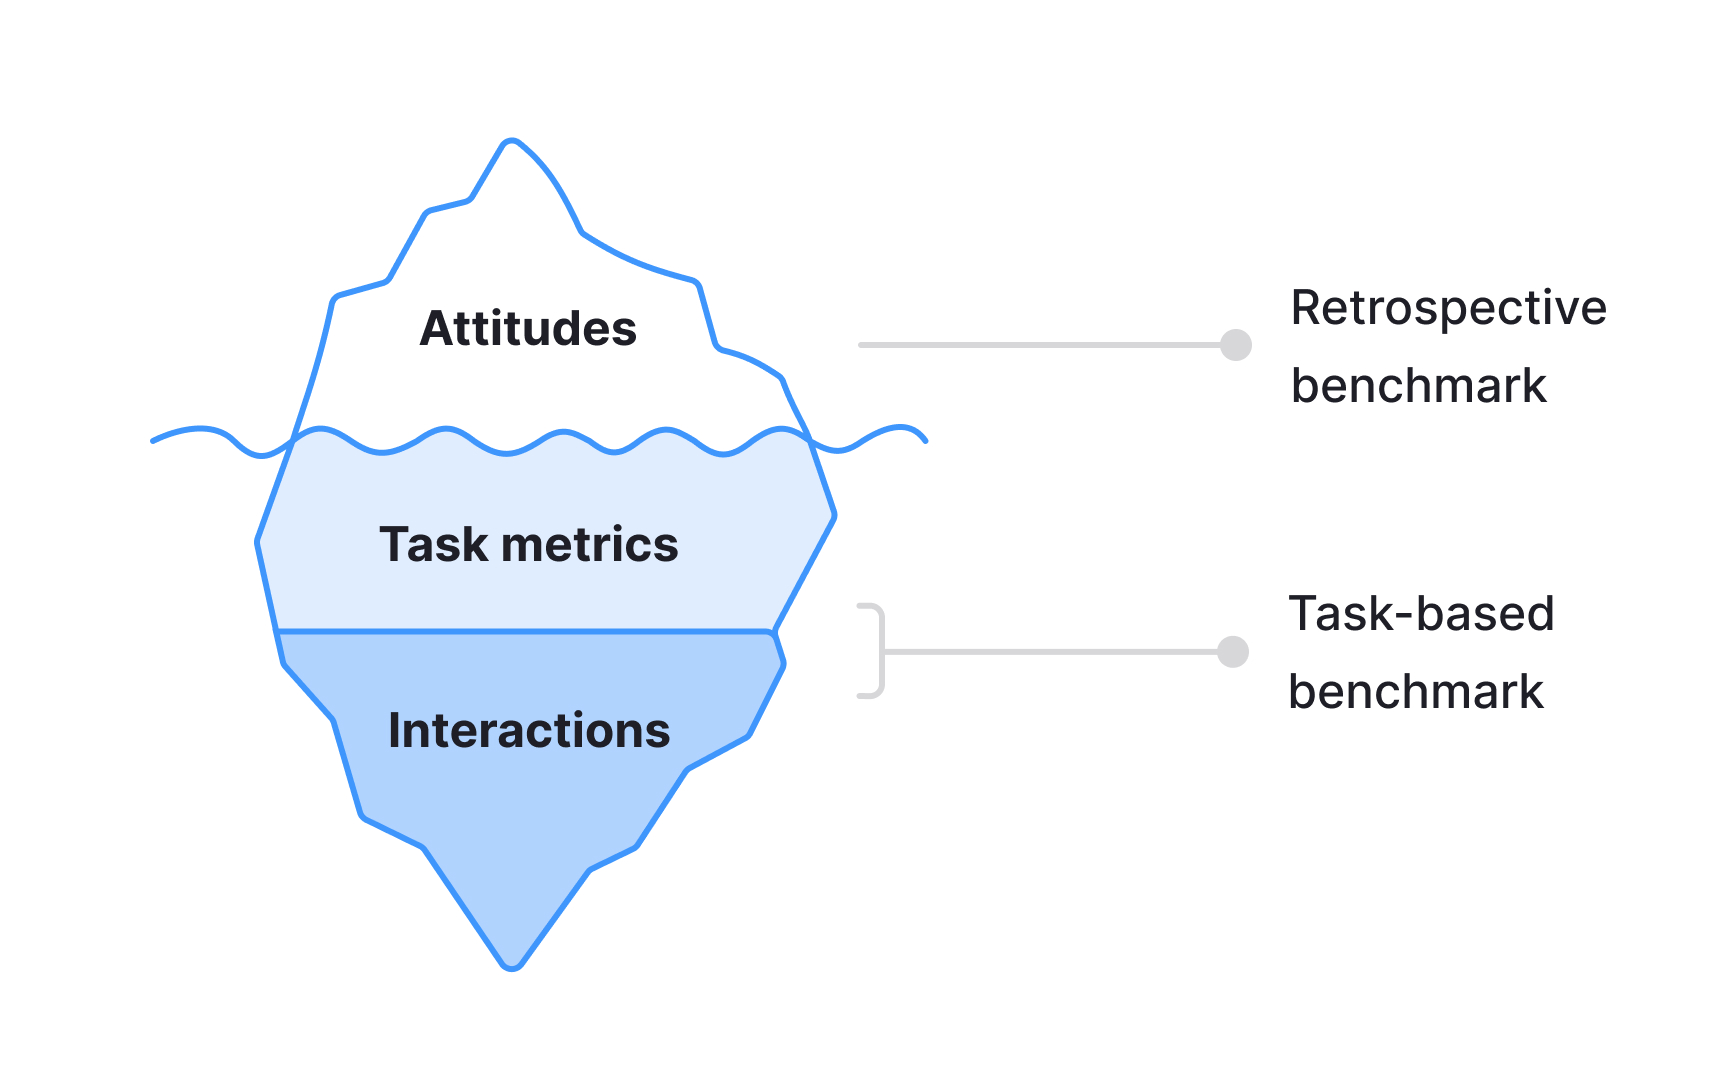
Combining eye tracking with concurrent think-aloud is generally not recommended. Asking users to narrate their thoughts while navigating alters natural visual behavior and introduces cognitive load that skews gaze data. Retrospective think-aloud, where participants comment while watching a replay of their own session, preserves more natural behavior while still capturing verbal insight.
In traditional lab-based setups, participants need to remain relatively still, as screen-based trackers lose accuracy when users shift position or fidget. Wearing glasses can also reduce accuracy due to lens reflections interfering with the tracking signal. These constraints are less significant with modern wearable trackers, but either way, the controlled conditions required for accurate data collection mean findings may not fully reflect real-world user behavior.
Pro Tip! Consider eye tracking studies only after you’ve conducted a series of regular usability tests and need to dig deeper.
Surveys
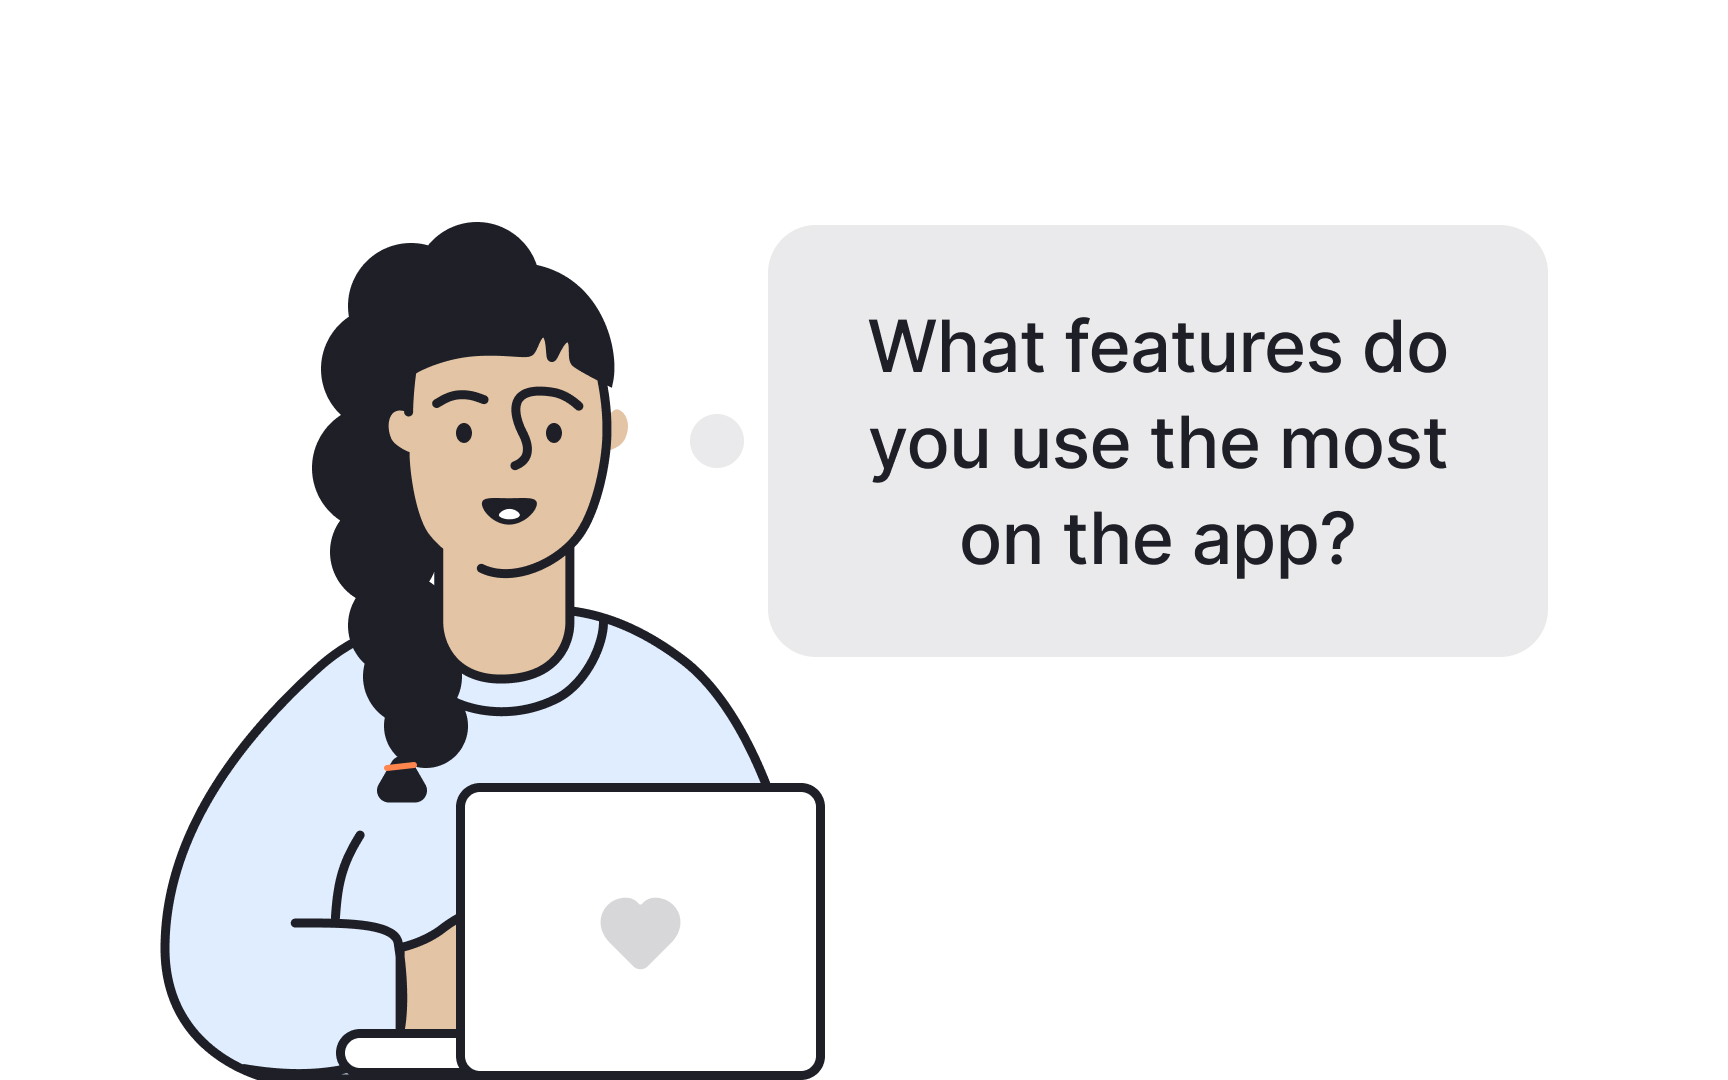


A survey is a cheap, flexible user research tool for gathering information about participants' preferences, attitudes, characteristics, and opinions on a given topic. Surveys consist of a set of questions and can be inserted on a live website, within an email body, or after user interviews or usability testing.
The simplicity of running a survey is misleading and often leads to bad surveys and useless data that don't give insights into users' problems.
What makes a survey effective?
- Define the goal. It's important to decide what you want to know and why a survey is the best way to obtain that information.
- Logically structure questions. Group related questions and separate them from other groups to help users navigate the form.
- Write questions in plain language. If users don't understand a question, they're likely to skip it or give answers that don't reflect their experience truthfully.
- Include open-ended questions. Open-ended questions provide more insight into users' thoughts. Also include multiple-choice questions to simplify the form completion process. While asking a direct 'Why?' might yield limited responses, taking a more layered approach can provide richer information. Consider supplementing multiple-choice questions with open-ended ones, such as 'Could you describe a situation where this feature was particularly helpful?'
- Be short. Long forms are tedious and likely to be abandoned before users even start.[2]
While surveys help better understand users, they are based on what users say and might not accurately reflect or explain user behavior. Thus, they should never be used to replace usability studies and interviews.
Pro Tip! Avoid using point scales to ask users how likely they will use a product or recommend it to a friend in the future. People are bad at making predictions, and this type of question doesn't reflect reality.
SUS scores
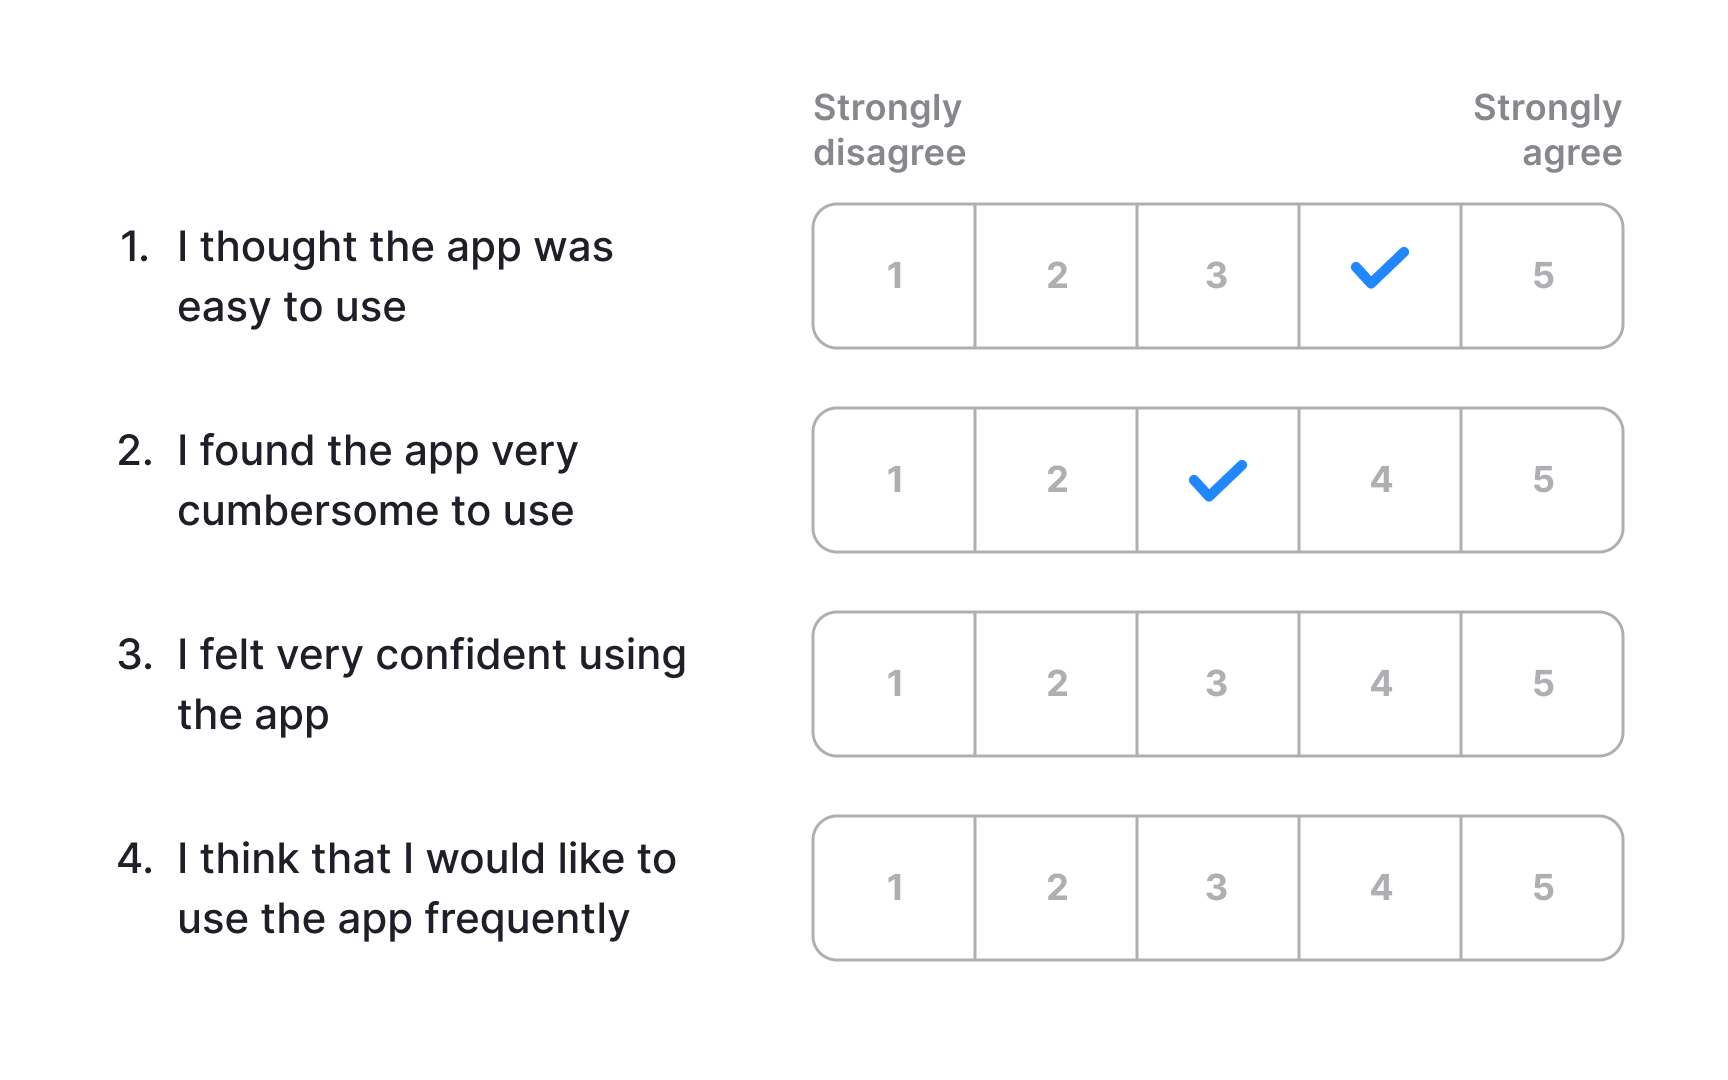
The System Usability Scale (SUS) is a lightweight, low-cost tool for measuring perceived usability. It consists of 10 statements with 5 response options ranging from Strongly Agree to Strongly Disagree, and can be used to evaluate virtually any product or service, including hardware, software, mobile devices, websites, and applications.
The final score ranges from 0 to 100, but it is not a percentage. The average SUS score across hundreds of studies is 68, which places a product at the 50th percentile. A score above 68 is considered above average, while anything below signals usability problems worth investigating. To communicate results clearly to stakeholders, it helps to convert the raw score into a percentile or letter grade, since a score of 72 out of 100 is not intuitively meaningful without that context.
SUS does not diagnose specific problems. It tells you how users perceive the overall usability of a product but gives no insight into which interactions caused friction or why. For that reason, it works best as a starting point, a quick signal that something needs attention, rather than a standalone evaluation method. Pairing it with usability testing or qualitative research surfaces the specific issues the score points toward.[3]
Web analytics
Analytics data shows how users interact with a live product, revealing patterns in behavior that other research methods can't capture directly. Many tools are available for this type of analysis, ranging from free options with broad feature sets to more specialized platforms built for product and UX teams.
Several types of reports are useful for UX analysis:
Pageview data tracks where users enter and exit a product, which paths they follow, and what devices they use. It gives a broad picture of how traffic moves across a site or app.
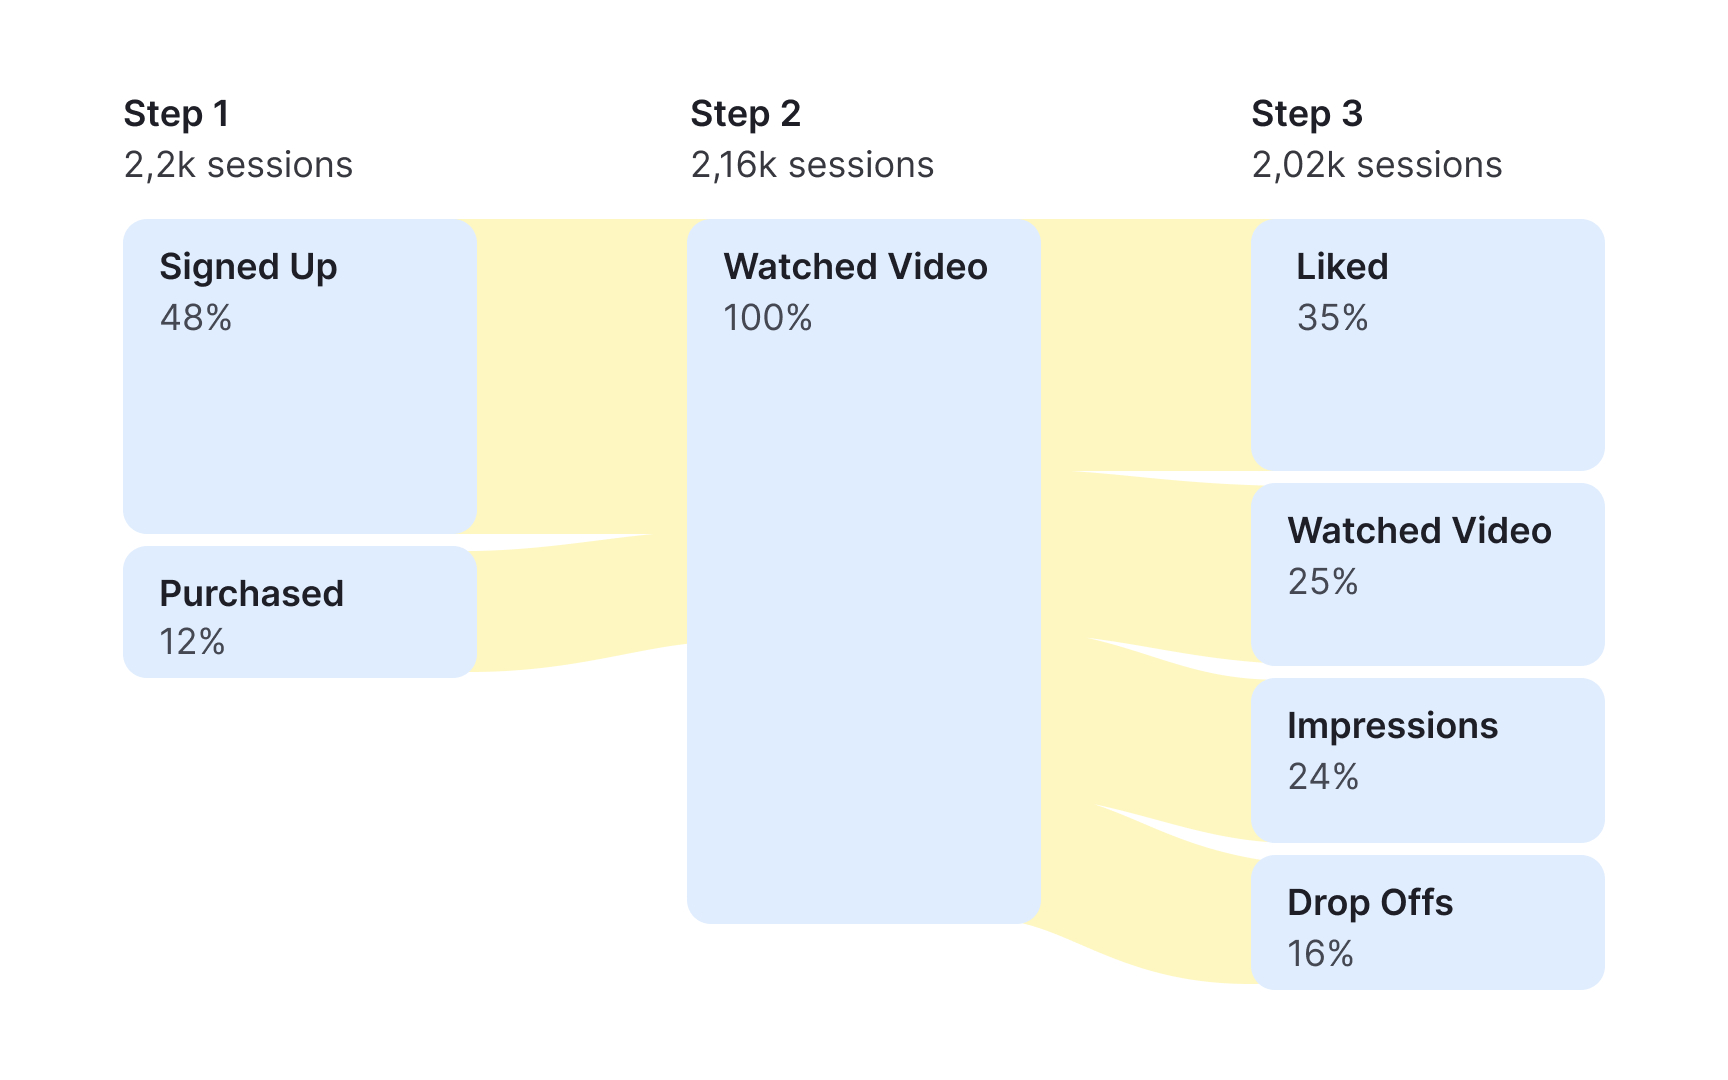
Behavior flow visualizes the sequence of pages or events users move through, making it easier to spot where they drop off or take unexpected routes.
Goals and funnels let you define target actions, such as completing a purchase, registering an account, or subscribing to a newsletter, and track how many users reach each step along the way.
Event tracking measures how users interact with specific elements on a page, such as uploading a file, clicking a settings icon, or opening a menu.
Time on task data shows how long users take to reach a goal or complete an action, which can surface friction points that slow users down.
Analytics data provides behavioral evidence of what users actually do, rather than what they say they do. That makes it a useful tool for aligning teams around research priorities and supporting decisions with measurable data.[4]
Usability benchmarking
Usability benchmarking is a method of evaluating a product's usability through metrics collected during quantitative usability testing. Like qualitative usability testing, it asks participants to complete realistic tasks in a system. The key difference is the focus: qualitative testing prioritizes observation, identifying specific usability issues as they emerge. Quantitative testing is focused on measurable outcomes, such as task completion rates, time on task, or error rates.
Studies can be conducted in person or remotely, with or without a moderator. Because the goal is to produce statistically reliable metrics, larger sample sizes are required than in qualitative research. The number of participants may range from 30 to 40 participants.[5]
Benchmarking data is most valuable when used comparatively. Common applications include:
- Tracking how a product's usability changes across design iterations over time
- Comparing usability against a competitor, an industry benchmark, or a stakeholder-defined goal
- Demonstrating the measurable impact of UX improvements to the wider team
Desirability studies
A desirability study is a user research method for measuring aesthetic appeal and identifying visual design directions that resonate with users and support the intended brand image.
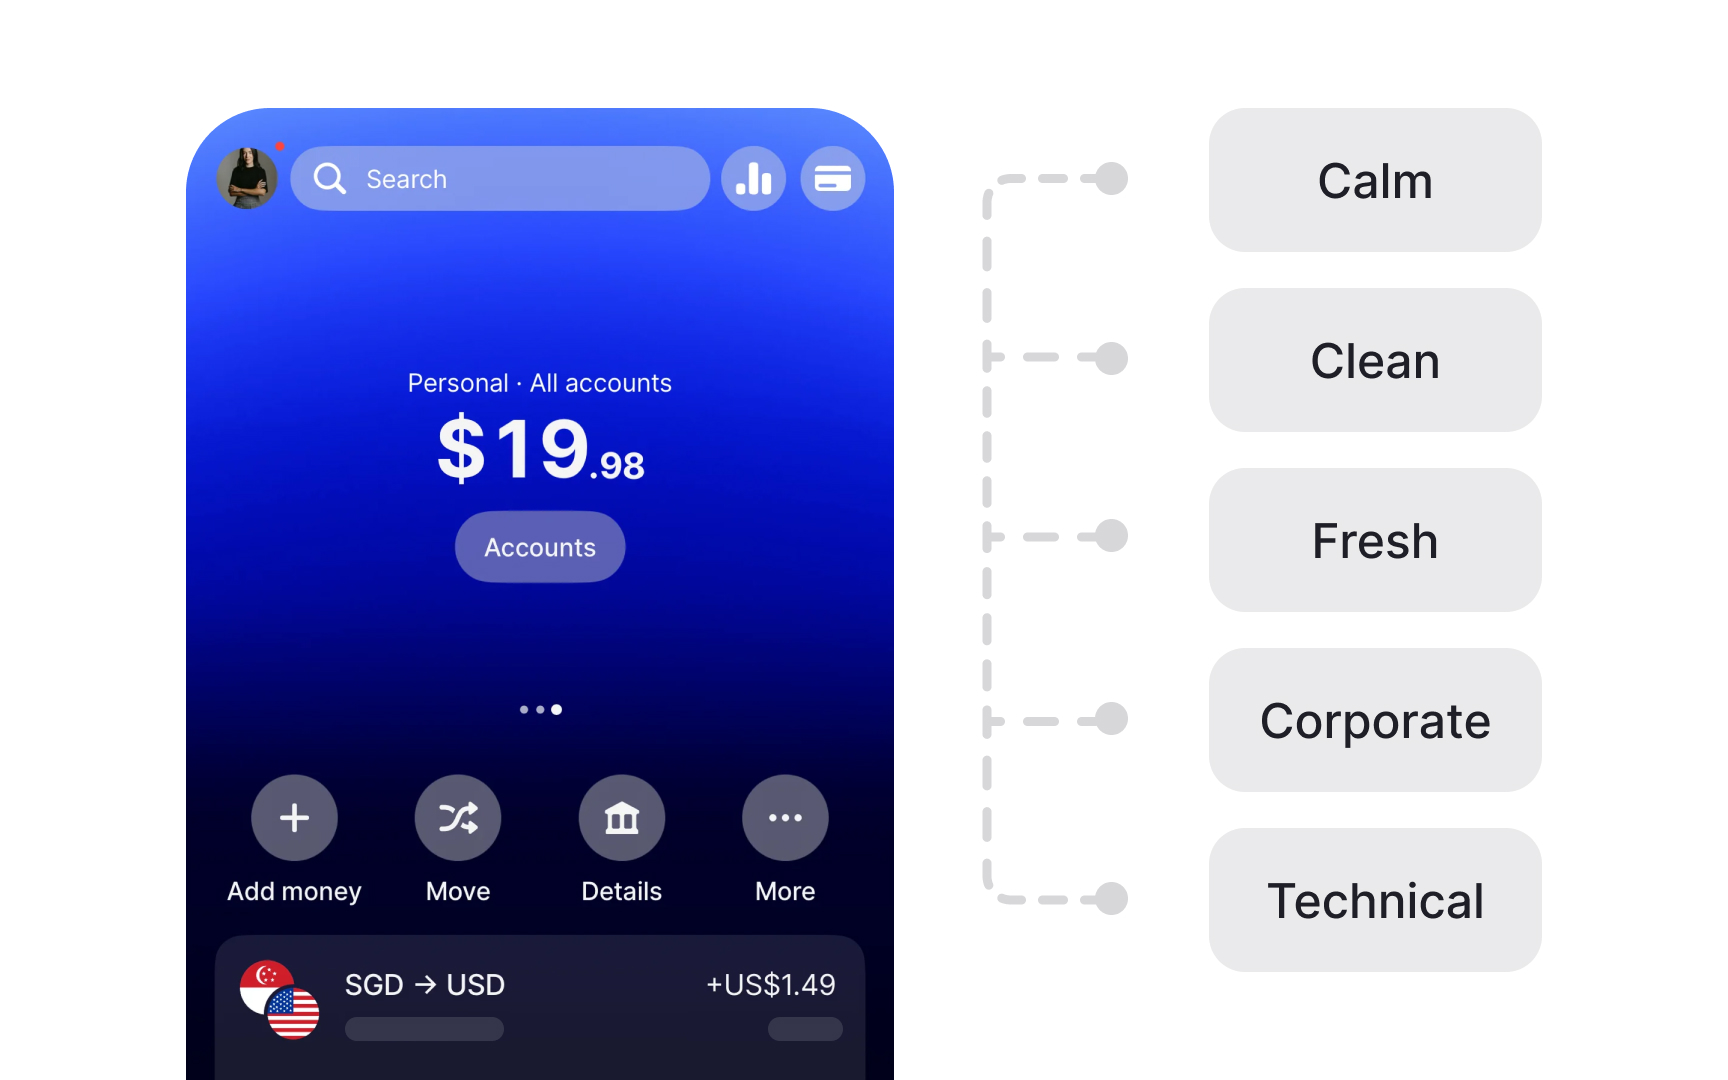
Participants are typically shown product images, prototypes, or different versions of the same interface. They then select adjectives from a predefined list to describe each design.
The Microsoft Desirability Toolkit, which is the most widely used framework for this method, provides 118 product reaction words ranging from "calm" and "trustworthy" to "overwhelming" and "dated." When running studies with larger groups, researchers analyze which words were selected most frequently and by what percentage of participants. Patterns across respondents reveal clear design preferences. For example, a significant share of participants might describe a green color palette as calming and approachable for a yoga app, while a dark blue version receives a more mixed set of reactions.[6]
Desirability studies are particularly useful for establishing a shared design direction and grounding conversations about visual preferences in participant data rather than internal opinion. The method's main limitation is that it captures what users say about a design, not how they interact with it. Pairing a desirability study with usability testing gives a more complete picture of both emotional response and functional performance.[7]
Topics
References
- Quantitative User-Research Methodologies: An Overview | Nielsen Norman Group
- Better User Research Through Surveys - UX Mastery
- Beyond the NPS: Measuring Perceived Usability with the SUS, NASA-TLX, and the Single Ease Question After Tasks and Usability Tests | Nielsen Norman Group
- When to Use Which User-Experience Research Methods | Nielsen Norman Group
- Quantitative vs. Qualitative Usability Testing | Nielsen Norman Group
- Desirability Studies: Measuring Aesthetic Response to Visual Designs - XDStrategy | XDStrategy
- Using the Microsoft Desirability Toolkit to Test Visual Appeal | Nielsen Norman Group