Product planning transforms strategy into action. Without structured planning and estimation, teams build features that miss deadlines, overpromise to stakeholders, and struggle to align on what's actually achievable. Good planning methods help teams break down complex work into manageable pieces, estimate effort accurately, and communicate timelines clearly across the organization. Estimation techniques solve a fundamental problem: humans fail at predicting absolute time but excel at comparing relative size. Teams need ways to discuss effort that account for complexity, uncertainty, and risk without pretending to know exactly how long something takes. Goal-setting frameworks turn vague aspirations into concrete targets with clear success criteria. Visualization tools make schedules, dependencies, and progress visible to diverse stakeholders who need different views of the same work. Effective planning isn't about predicting the future perfectly. It's about creating shared understanding across teams, setting realistic expectations with stakeholders, and building systems that adapt as learning happens. These frameworks help teams move from guesswork to informed estimates, from vague objectives to actionable plans, and from reactive firefighting to proactive product development.
Story points
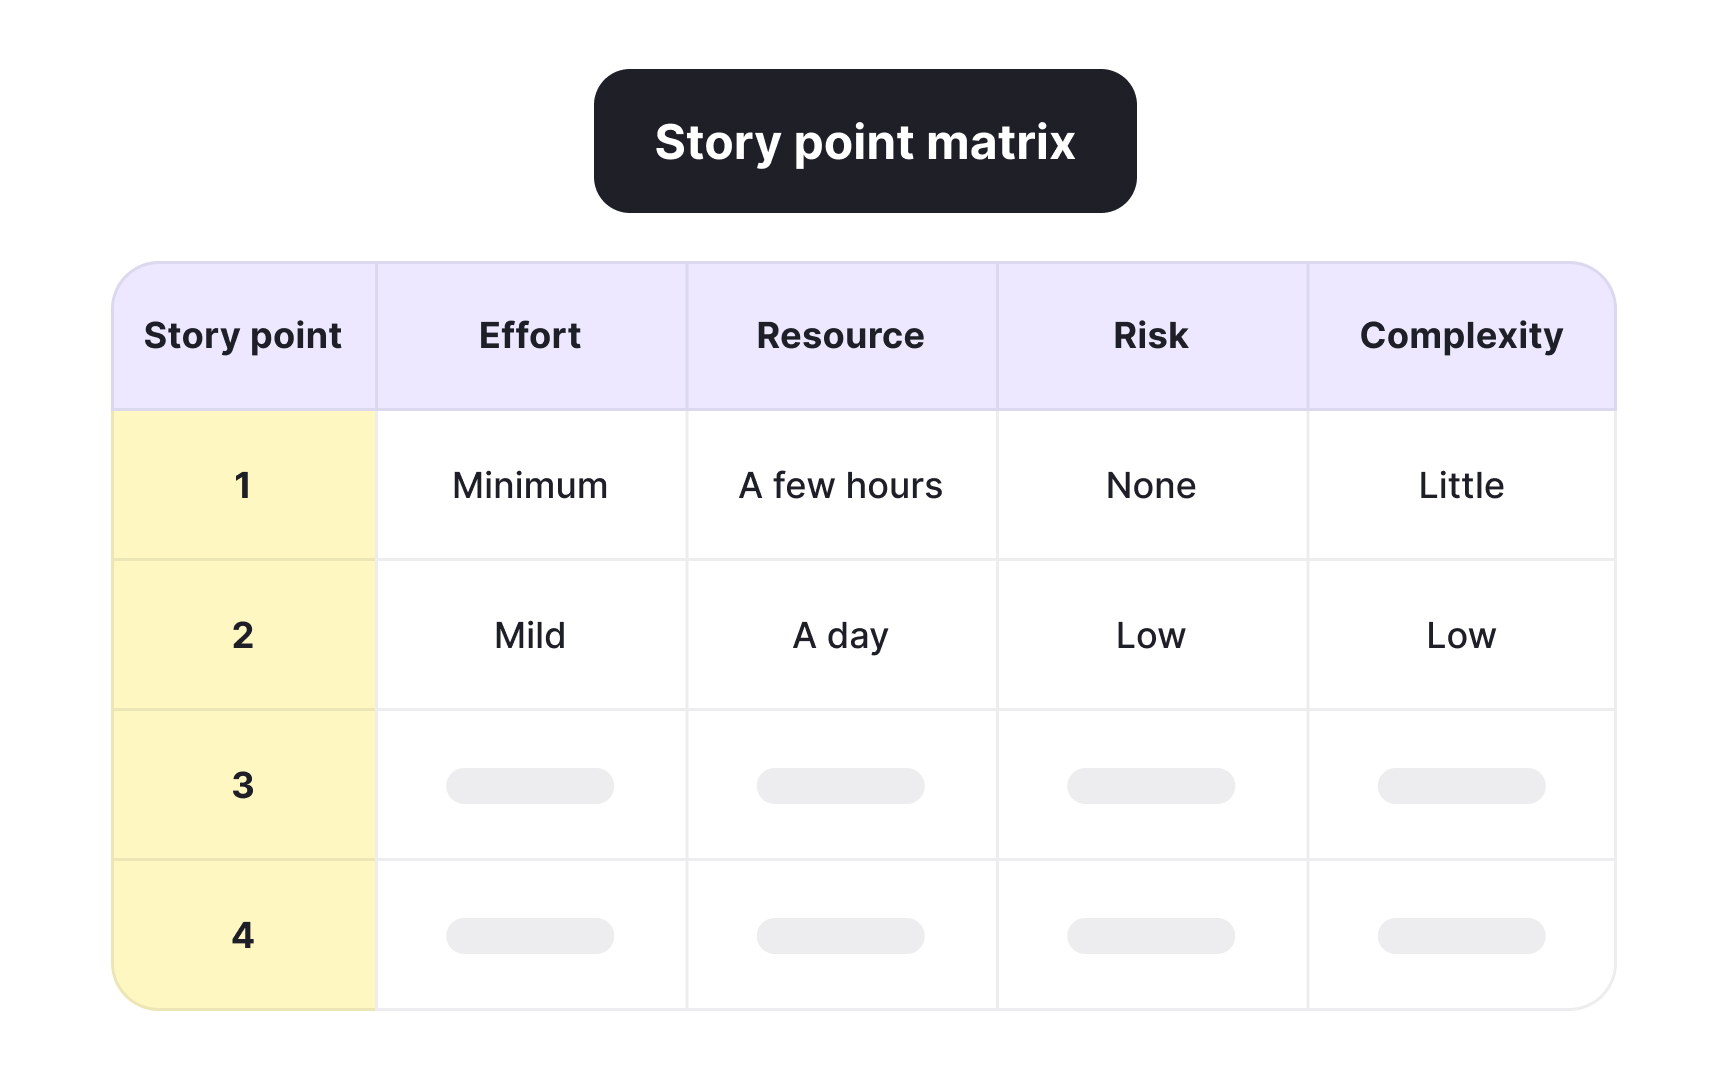
Story points are a unit of measurement that estimates the overall effort required to complete a product backlog item or user story. Rather than predicting exact hours or days, story points represent relative effort by considering complexity, uncertainty, and risk together. Teams assign point values like 1, 2, 3, 5, 8, or 13 based on how much work an item requires compared to other items. The key insight behind story points is that humans are better at comparing things than making absolute predictions. If one story is assigned 2 points and another gets 5 points, the team believes the second story requires roughly 2.5 times more effort. This relative approach accounts for the reality that different team members work at different speeds, but everyone can agree that certain tasks are bigger than others. Story points measure 3 factors together:
- Complexity considers how difficult the work is and how many steps it requires.
- Risk includes uncertainty, dependencies on third parties, and the likelihood of problems occurring.
- Effort represents the actual time investment needed.
Teams discuss these factors collaboratively during estimation sessions, ensuring everyone understands what's involved and what could go wrong. The power of story points lies in creating shared understanding rather than false precision. Teams avoid debates about whether something takes 7 hours versus 8 hours, instead focusing on whether the work is small, medium, or large relative to past experience. Over time, teams track their velocity of how many story points they complete per sprint, which helps predict future capacity without forcing developers to commit to hourly estimates they can't control.[1]
Fibonacci agile estimation
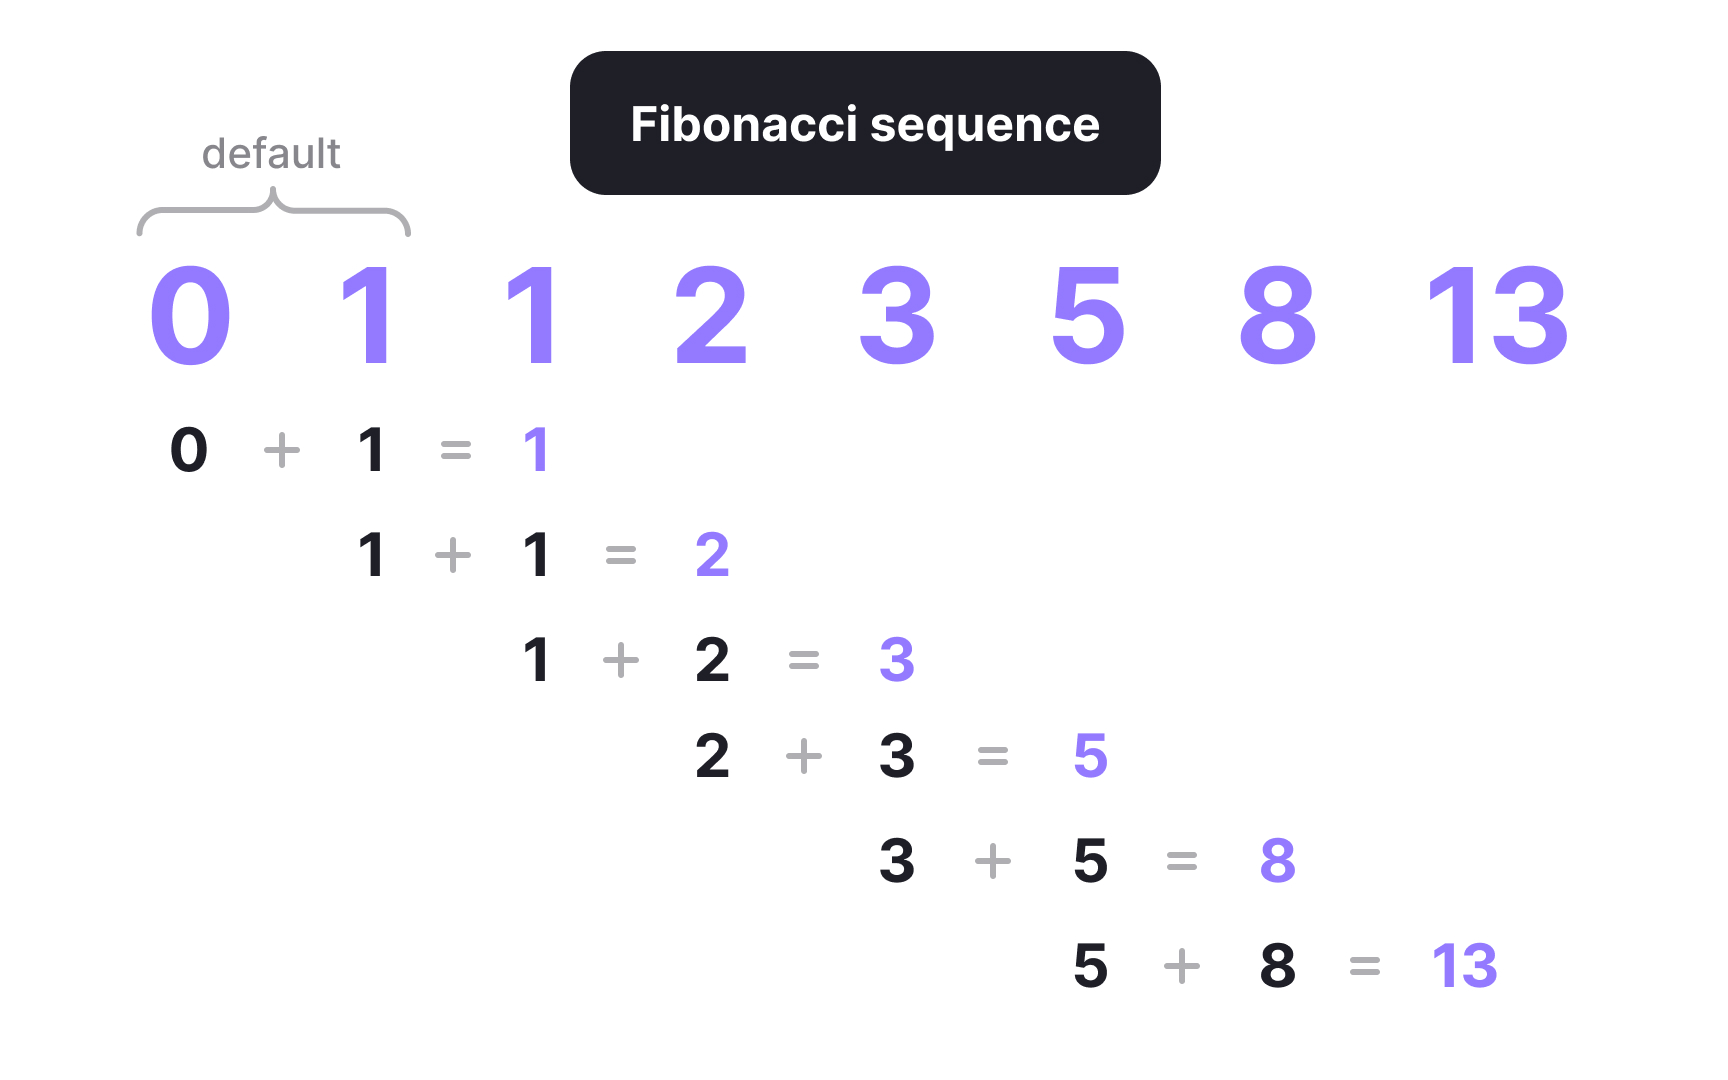
Fibonacci agile estimation uses numbers from the Fibonacci sequence (1, 2, 3, 5, 8, 13, 21, 34) to assign story points to backlog items. In this mathematical sequence, each number equals the sum of the two preceding numbers, creating progressively larger gaps between values. Many agile teams use a modified version like 1, 2, 3, 5, 8, 13, 20, 40, 100 for practical reasons.
The Fibonacci scale works because humans perceive differences proportionally rather than absolutely. According to Weber's Law, we can roughly distinguish a 60% difference in effort between 2 estimates. The Fibonacci numbers grow by approximately this rate, making each jump feel distinct and meaningful. You can easily tell the difference between 3 points and 5 points, or between 13 points and 21 points, but distinguishing between 21 points and 22 points would be meaningless precision.
As tasks grow larger, they naturally become more uncertain and complex. The Fibonacci scale captures this through its widening gaps. A 1-point task is predictable and well-understood. A 13-point task involves much more uncertainty, hidden complexity, and potential for unexpected challenges. The growing gaps between numbers acknowledge this increasing ambiguity as work scales up. The Fibonacci scale also discourages false precision. Early agile teams tried using 21 story points but found stakeholders assumed it meant something more exact than 20 or 25. This implied precision that the team couldn't actually provide. Using 20 instead of 21 signals appropriate uncertainty. The same principle applies to using 40 and 100 for very large work items. These values communicate scale without pretending to fine-grained accuracy that the team doesn't possess.[2]
SMART goal setting
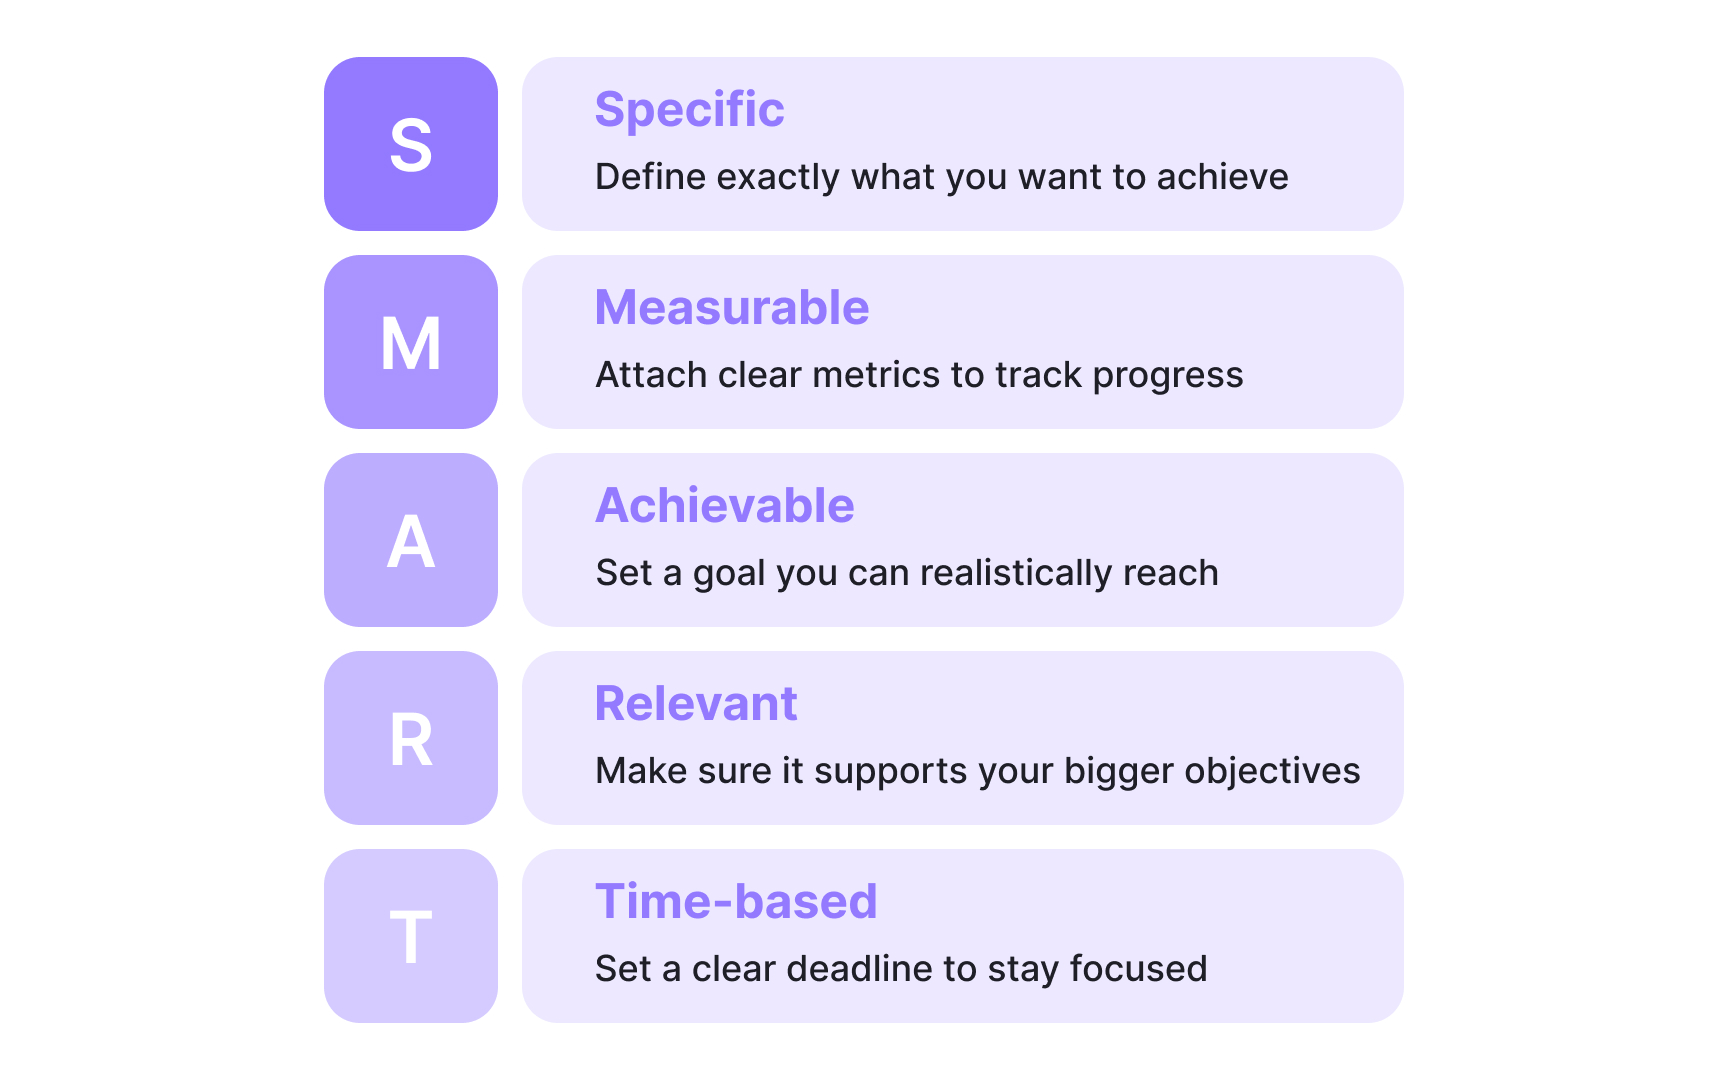
SMART goal setting is a framework that makes objectives specific, measurable, achievable, relevant, and time-bound. Introduced by George T. Doran in 1981, this method transforms vague aspirations into concrete targets that teams can actually execute. Product managers use SMART goals to cut through complexity, align stakeholders, and create clear success criteria for their work:
- Specific goals answer fundamental questions: What exactly are we accomplishing? Who's responsible? What steps will we take? Instead of "improve user engagement," a specific goal states "increase daily active users by implementing three new retention features."
- Measurable goals include quantifiable outcomes like percentages, numbers, or completion rates that show whether you succeeded. "Reduce churn by 2 percentage points" is measurable, while "make users happier" is not.
- Achievable goals are ambitious yet realistic given your team's resources, skills, and timeline. Setting impossible targets demotivates teams, while easy goals waste potential.
- Relevant goals align with business objectives and product vision. They matter to stakeholders and move the company forward. A relevant goal for a SaaS product might target expansion revenue, not unrelated metrics.
- Time-bound goals include specific deadlines like "by the end of Q2" or "within three months," creating urgency and accountability.
SMART goals prevent common product management problems. They stop endless debates about priorities by making objectives concrete and comparable.[3]
Timeline roadmap
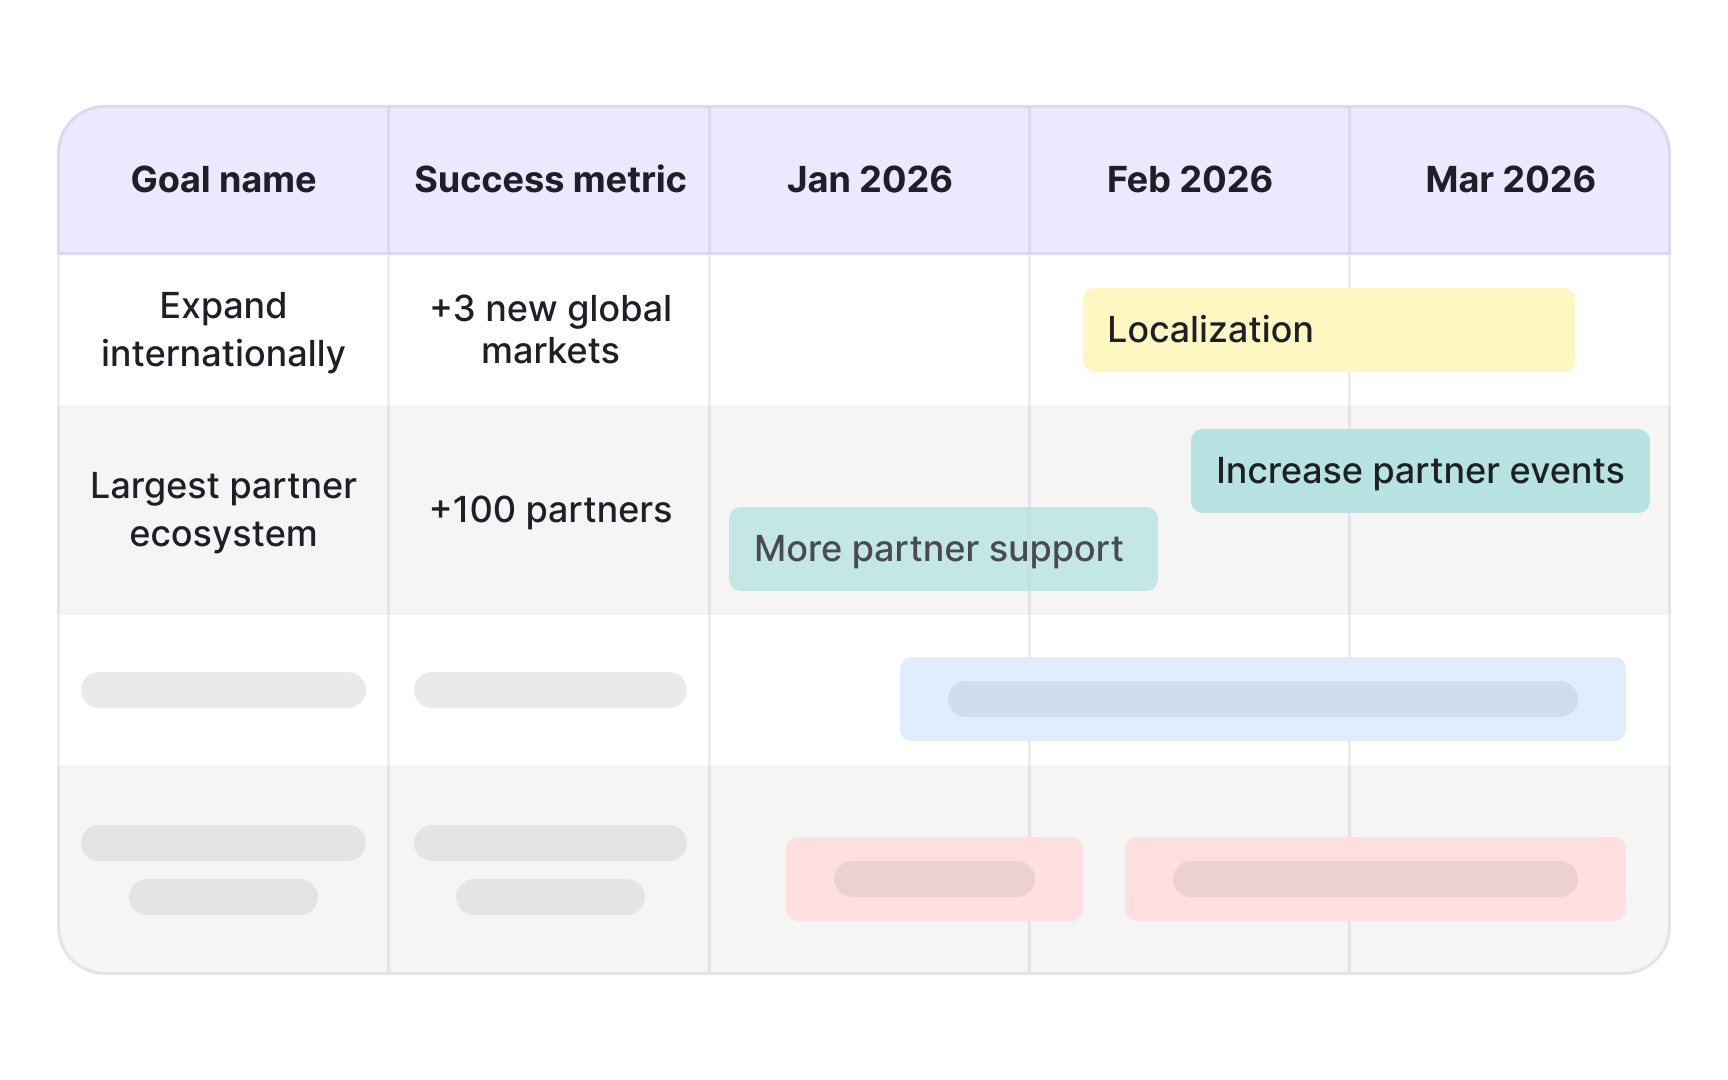
A timeline roadmap displays product initiatives, releases, and features across a calendar-based view showing when work will happen. Unlike feature-based roadmaps that prioritize without dates, timeline roadmaps commit to specific timeframes like quarters, months, or sprints. They answer the question "when will this be ready?" which matters deeply to stakeholders planning launches, sales cycles, or business commitments.
Timeline roadmaps organize work horizontally across time periods with swim lanes for different themes, teams, or product areas. Bars or blocks represent initiatives with start and end dates, and dependencies appear as connecting lines. Color coding indicates status: planned, in progress, completed, or at risk.
The format provides clarity for stakeholders like sales, marketing, and executives who coordinate releases with their plans. Sales teams see when enterprise SSO launches to target large accounts. Marketing prepares campaigns around committed dates. However, timeline roadmaps can become binding commitments that pressure teams to cut quality or scope when facing delays.
Product managers balance timeline commitments with agile flexibility. Some teams use "now, next, later" buckets where only the "now" timeframe has firm dates. Others include confidence levels like "high confidence" or "subject to change." The key is communicating what's firm versus provisional, helping stakeholders understand which dates they can rely on versus which represent estimates that might shift as teams learn more.[4]
Pro Tip! Balance timeline commitments with flexibility by marking confidence levels or provisional dates.
Project roadmap
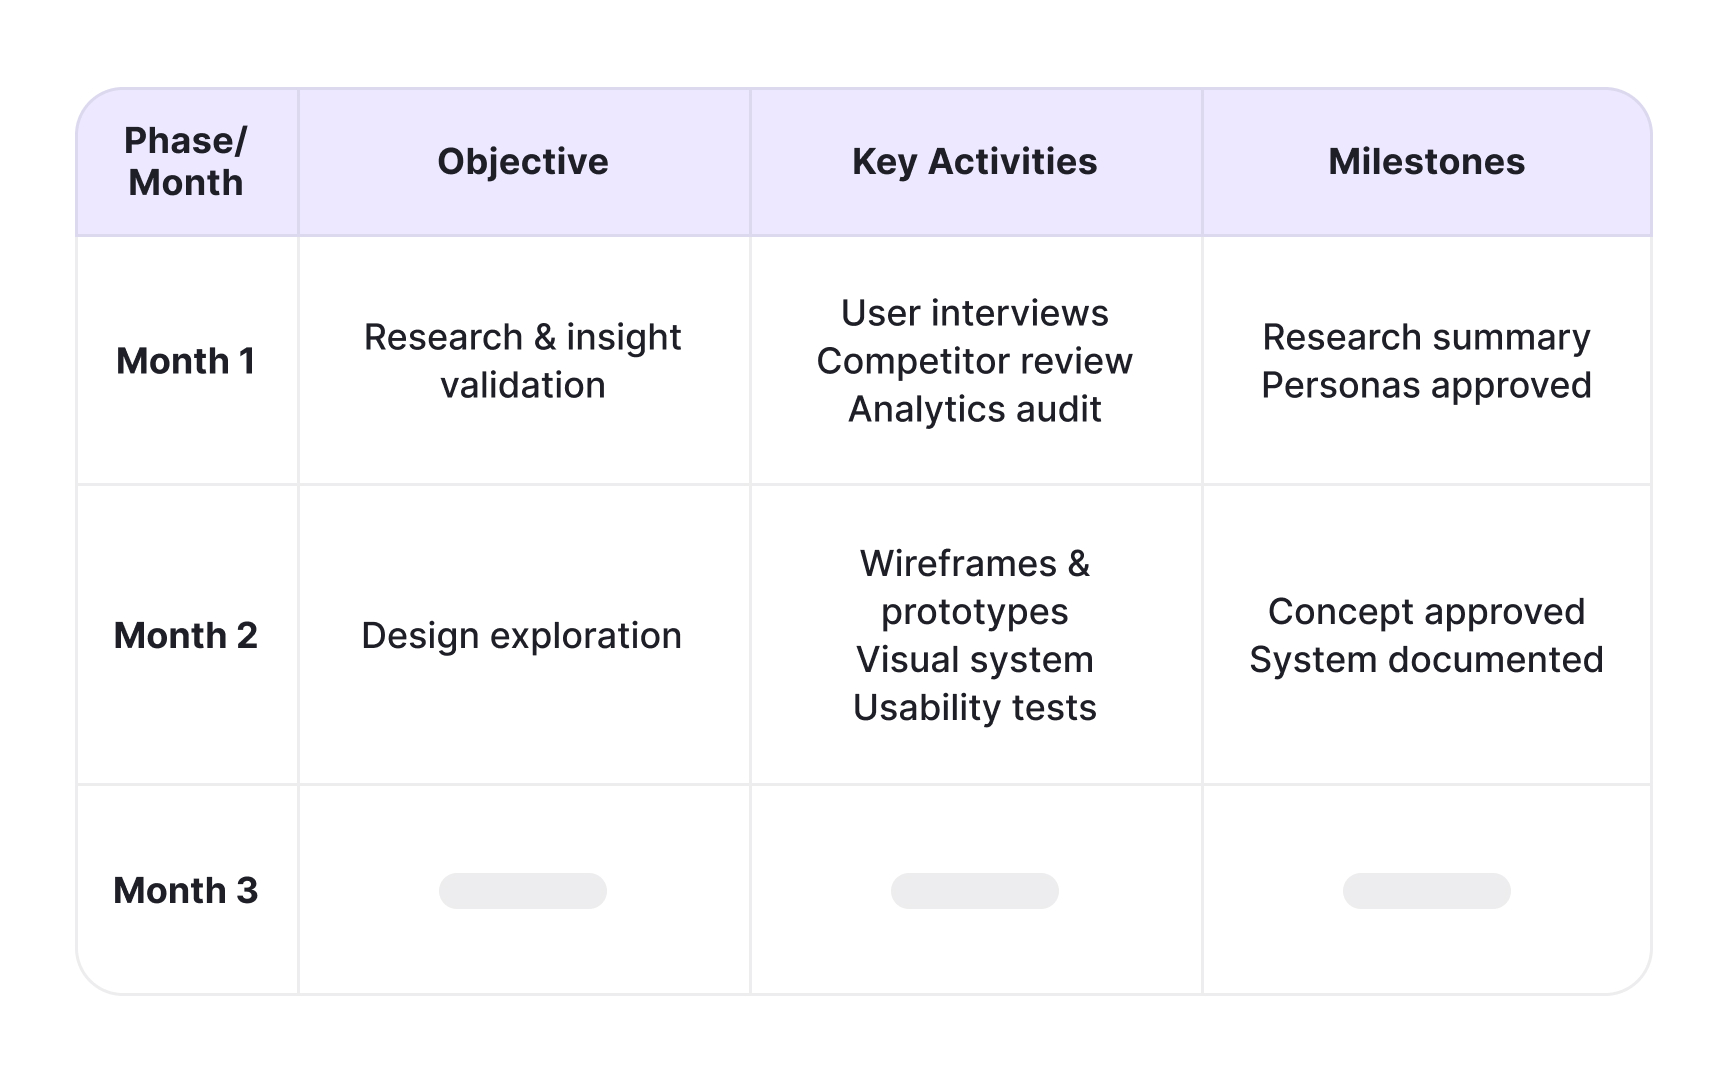
A project roadmap is a high-level visual plan for completing a specific, time-bound initiative with a defined beginning and end. The key distinction is scope: project roadmaps focus on one major effort like a platform migration, market launch, or system replatforming, not ongoing product development. Once the project completes, the roadmap ends, unlike product roadmaps that continue evolving with the product.
Project roadmaps break the single initiative into phases and milestones, showing progress and dependencies. A platform migration might have phases like "planning and assessment," "pilot migration," "full rollout," and "legacy system retirement." Each phase contains deliverables, responsible teams, and success criteria. Milestones mark critical decision points like "migration strategy approved" or "pilot users migrated successfully."
The roadmap helps stakeholders understand their role in completing this specific project. Engineering sees technical deliverables and dependencies. Marketing knows when to prepare communications. Customer success understands when training happens. Project roadmaps create shared visibility across functions for this particular initiative, reducing surprises and ensuring everyone coordinates toward the same finish line.
Product managers use project roadmaps when a major effort requires dedicated focus and coordination across multiple teams. Examples include rebuilding onboarding from scratch, launching in a new geographic market, or replatforming infrastructure. For the steady stream of features and improvements that never truly finish, they use product roadmaps instead. The distinction is whether there's a clear completion point or continuous evolution.[5]
Gantt chart
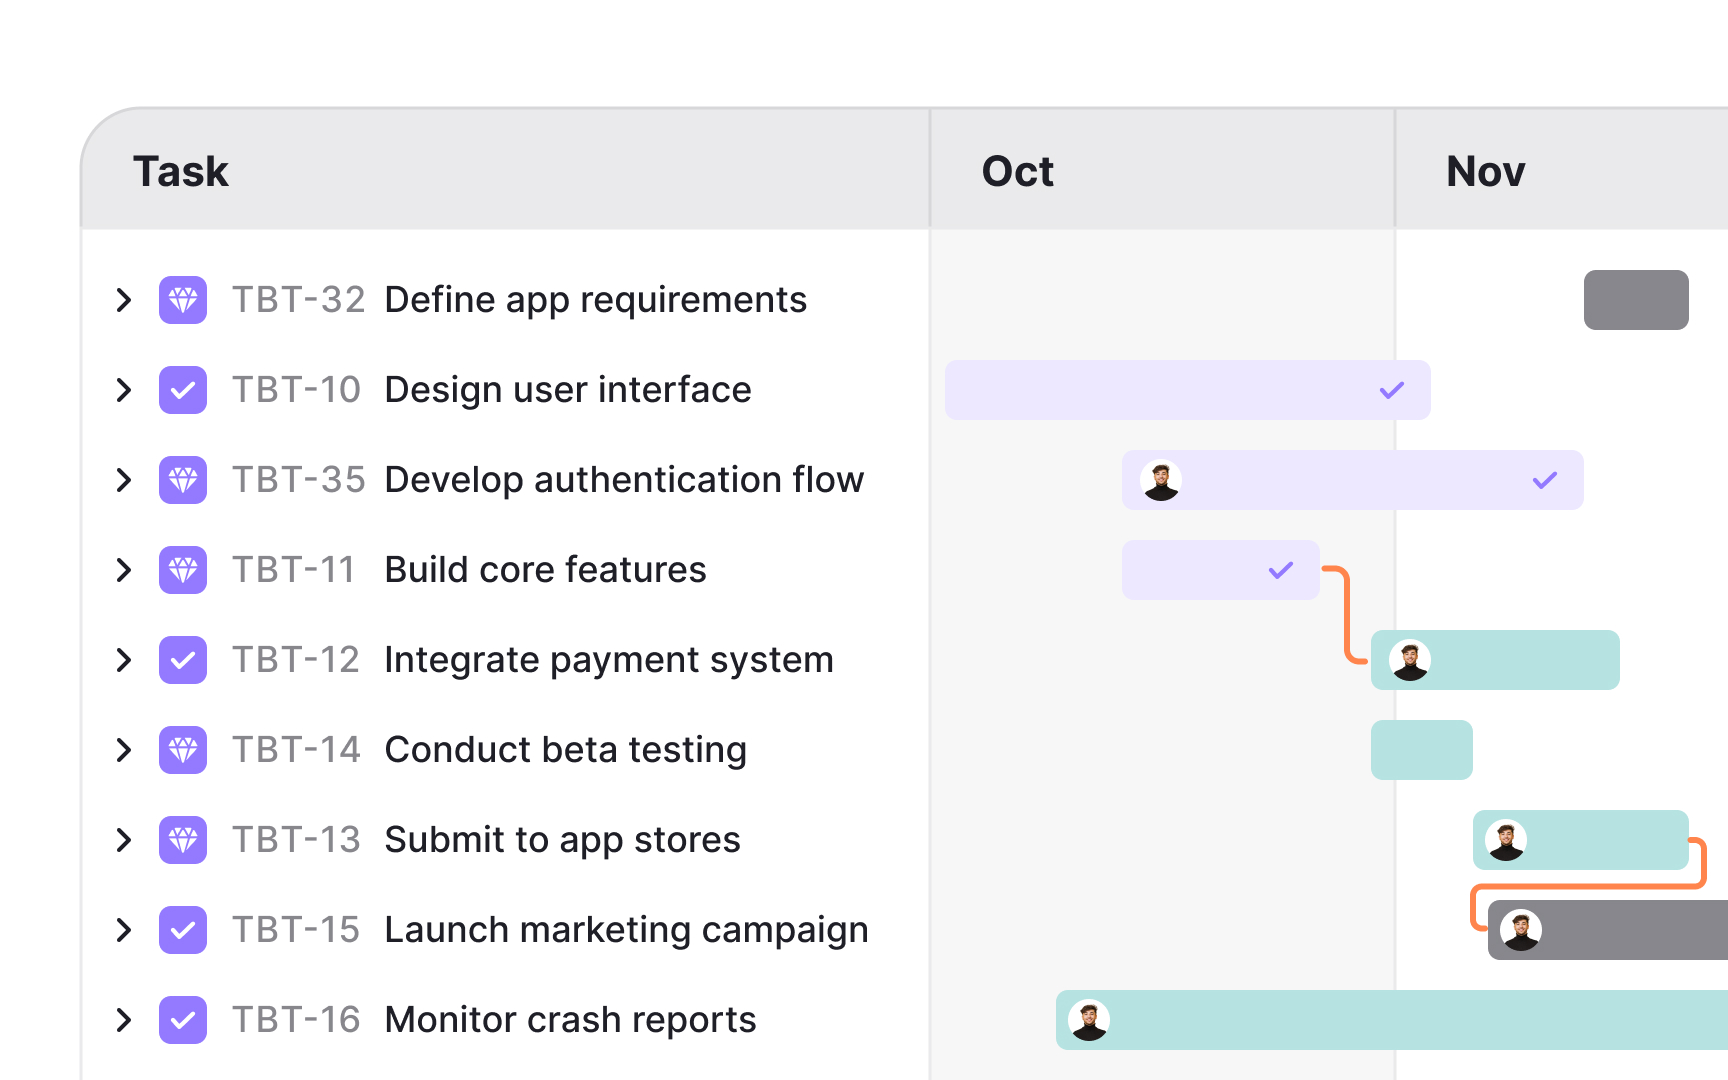
A Gantt chart visualizes project schedules through horizontal bars showing task duration, dependencies, and progress across a timeline. Developed by Henry Gantt in the 1910s, this chart type makes complex schedules instantly understandable. Each row represents a task or deliverable, with bars extending across dates to show when work starts and finishes.
The power of Gantt charts lies in showing dependencies between tasks. Arrows connect dependent tasks, revealing which work must finish before other work begins. For example, "design approval" must be completed before "development starts," which must be completed before "QA testing begins." These connections help teams sequence work logically and identify the critical path, the sequence of dependent tasks determining the minimum project duration.
Gantt charts excel at exposing schedule conflicts and resource constraints. If 3 tasks overlap but all require the same developer, the team spots this overallocation immediately. If one task is delayed by 2 weeks, the chart shows how that cascades through dependent tasks. This visibility enables proactive replanning rather than discovering conflicts when deadlines are missed.
However, Gantt charts work best for predictable work with known tasks and dependencies. They struggle with agile development where requirements emerge and priorities shift frequently. Creating detailed Gantt charts for uncertain work creates false precision and maintenance overhead. Product managers use Gantt charts for infrastructure projects, launches, or implementations with clear steps, while using backlogs and sprint planning for ongoing feature development where flexibility matters more.[6]
PERT chart
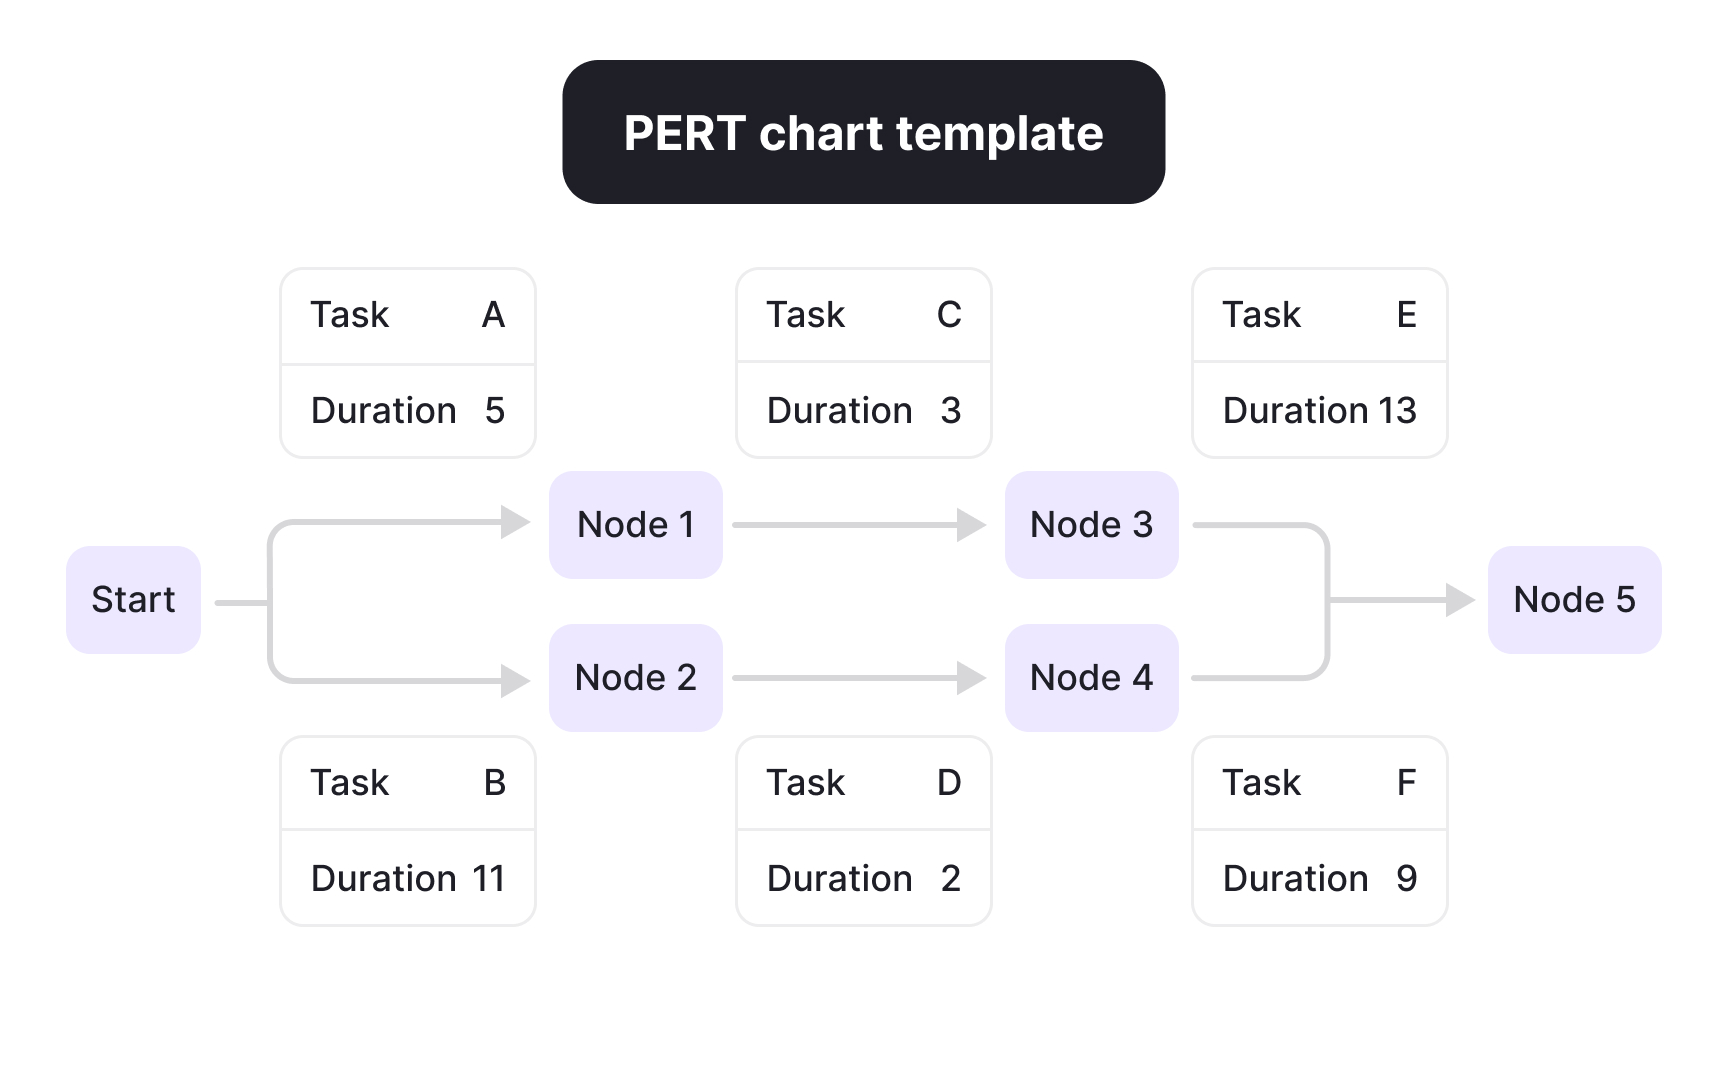
PERT, or Program Evaluation and Review Technique, is a project management tool that uses network diagrams to show task dependencies and critical paths. Developed by the U.S. Navy in the 1950s for the Polaris missile program, PERT charts help teams plan complex projects where timing and task sequencing matter critically.
PERT charts use nodes (circles or boxes) representing project milestones, connected by arrows representing activities needed to reach each milestone. Unlike Gantt charts that emphasize calendar duration, PERT charts emphasize logical task relationships. The critical path, the longest sequence of dependent activities, determines the minimum project duration. Any delay on the critical path delays the entire project.
PERT's key feature is probabilistic estimation. Teams provide 3 time estimates for each activity: optimistic, most likely, and pessimistic. The method calculates expected duration using the formula (optimistic + 4 × most likely + pessimistic) ÷ 6. This statistical approach acknowledges uncertainty and produces realistic timelines rather than best-case scenarios, particularly valuable for novel work where teams lack historical data.
PERT charts work best for projects with clear phases and well-understood tasks, like construction, product launches, or regulatory compliance. They require significant upfront effort to identify all activities and dependencies. Product managers use PERT for major launches or infrastructure projects but rely on agile methods for ongoing feature development where flexibility outweighs detailed planning.[7]
PDCA cycle
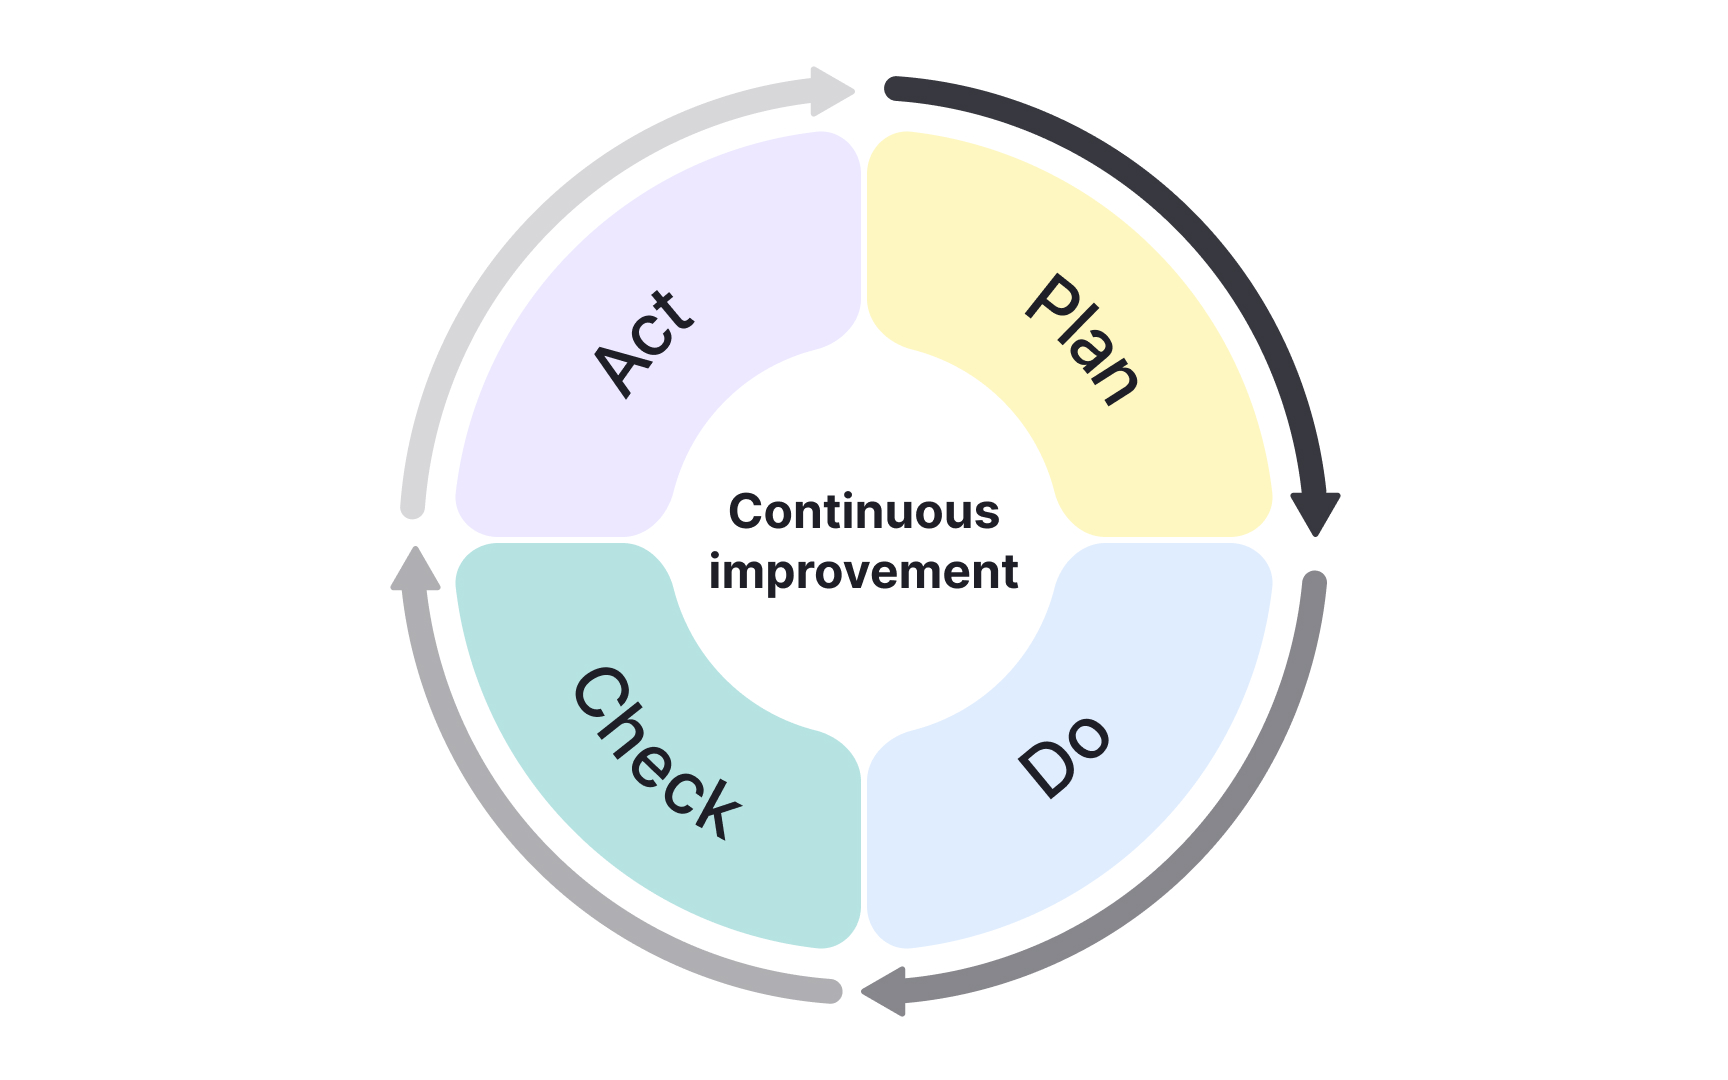
The PDCA cycle, or Plan-Do-Check-Act cycle, is a continuous improvement method for testing changes and learning from results. Also called the Deming cycle after quality pioneer W. Edwards Deming, this four-step framework creates structured experimentation. Product teams use PDCA to incrementally improve features, processes, or metrics through repeated cycles:
- Plan involves identifying a problem and designing a small-scale test.
- Do means implementing the change on a limited scope first, reducing risk if it doesn't work.
- Check requires measuring results against predictions.
- Act means deciding next steps: adopt if successful, adjust if partially successful, or abandon if unsuccessful.
The cycle then repeats based on learnings. PDCA creates an experimentation culture where teams iterate rather than expecting perfection immediately. Small, reversible experiments reduce fear of failure. Successful changes become the baseline for the next improvement cycle. Product managers apply PDCA to various challenges. Testing new onboarding? Plan the change, implement for a small segment, check metrics, then roll out, iterate, or revert. Reducing bugs? Plan process changes, implement with one team, check data, and act on results. PDCA works well when unsure whether a change helps, turning uncertainty into structured learning.[8]
Topics
References
- What are story points in Agile and how do you estimate them? | Atlassian
- Agile Estimation: Why The Fibonacci Sequence Works | Mountain Goat Software
- SMART Goal Setting | ProductPlan
- Setting Product Goals: A Guide for PMs
- Project Roadmap vs. Product Roadmap | Productboard
- What is a Gantt Chart? Features & Benefits With Free Template | Atlassian
- PERT Chart: The Ultimate Guide (with Examples) | ProjectManager
- PDCA Cycle: definition, methods and examples | DNV | DNV