Metrics often look objective, but the way they are chosen and framed can quietly steer a product in very different directions. In case studies, metrics are not just proof of impact. They explain how a team understood the problem, evaluated options, and decided what mattered most.
Strong case studies start by defining success clearly. This means turning goals into concrete KPIs, understanding which signals predict future outcomes, and knowing which results only appear after the fact. Leading and lagging indicators play different roles in this story, and confusing them often leads to shallow conclusions or misleading wins.
Metrics also create constraints. Guardrail metrics exist to protect user experience, product health, or trust when teams push for growth or engagement. They help show awareness of tradeoffs and unintended consequences, which is a critical skill in PM decision-making.
Not every problem needs the same type of measurement. A usability issue, a retention drop, or a monetization experiment all call for different success signals. Choosing the right metrics for the problem type reveals product sense and prevents vanity metrics from shaping solutions in the wrong direction.
Defining success before picking metrics for a case study
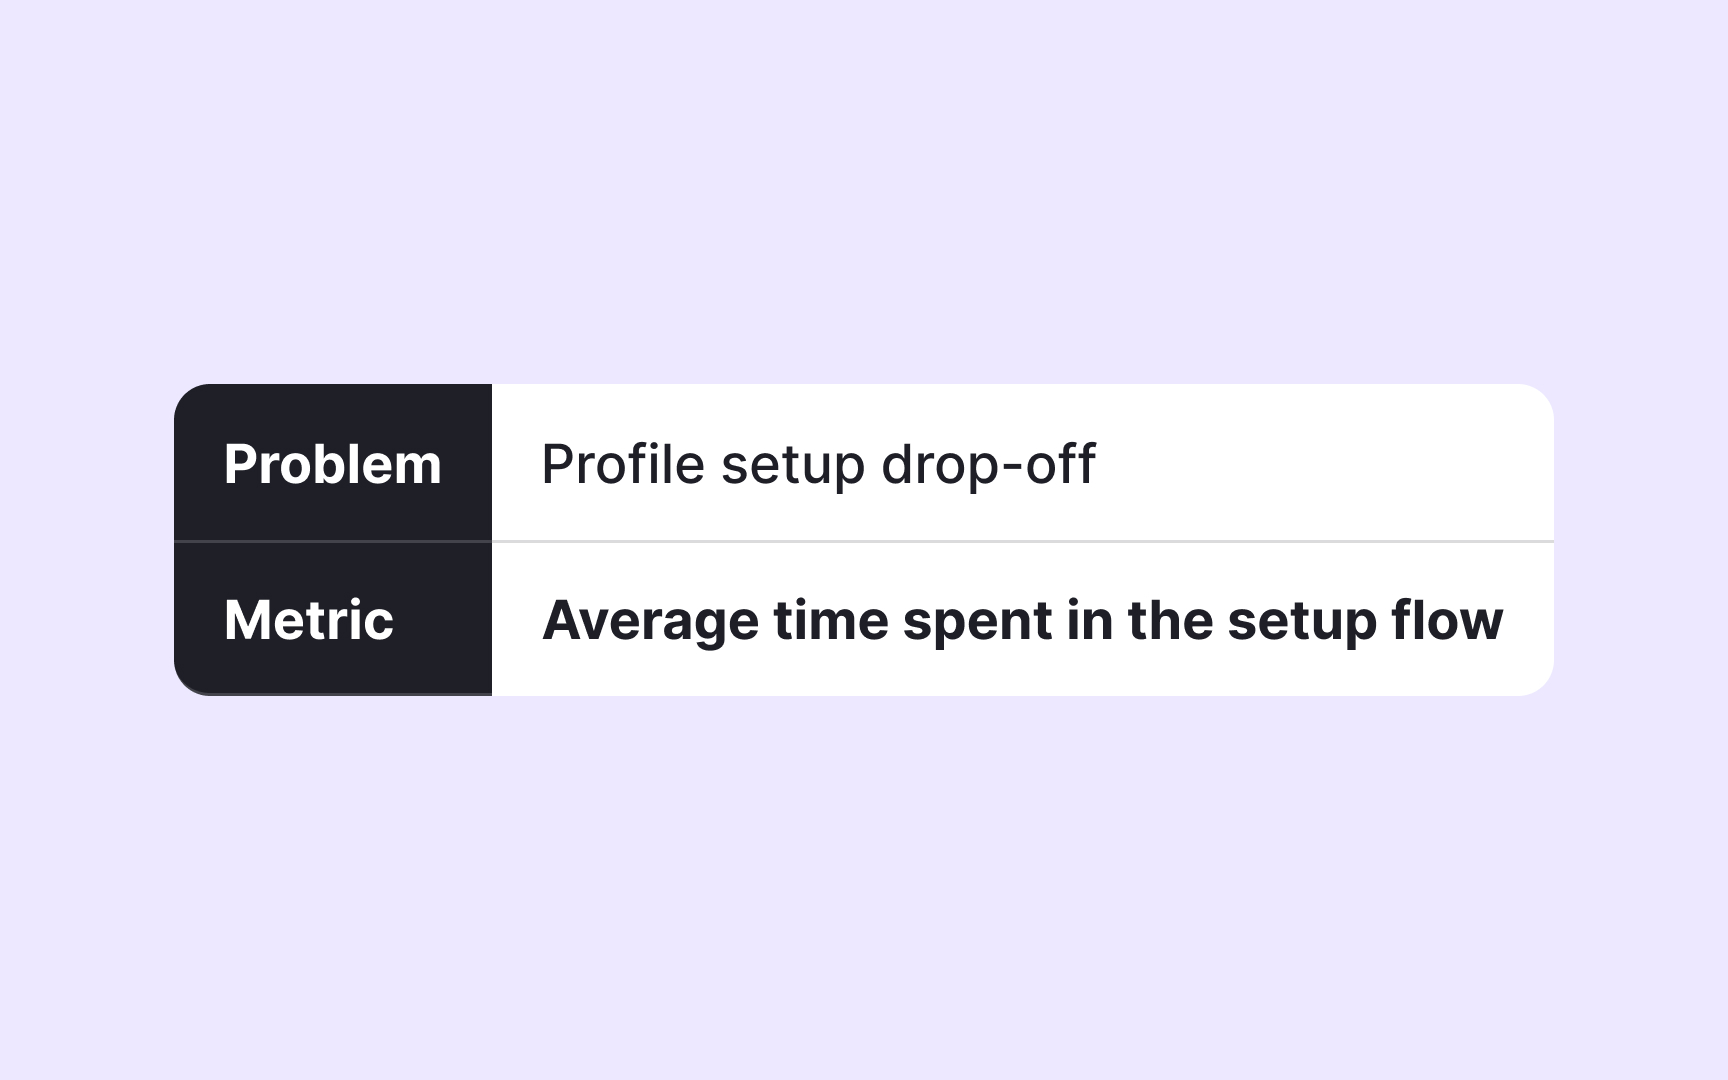
Success in a case study starts before any metric appears. A product team first clarifies what change they want to create in the product or for users. This step anchors the entire story. Without it, metrics risk becoming isolated numbers that look impressive but fail to explain why a decision was made.
Different goals lead to very different definitions of success. Improving onboarding is not the same as increasing revenue or speeding up delivery. Each goal highlights a different kind of outcome, such as activation, retention, or efficiency. When success is vague, teams often default to familiar metrics like usage counts or revenue, even when those do not reflect the real problem.
In strong case studies, success is framed as a concrete outcome tied to a specific problem. This makes later metric choices easier to follow and easier to challenge. It also shows discipline in thinking. Metrics become evidence of progress toward a goal, not a substitute for the goal itself.[1]
Pro Tip! If success cannot be described without numbers yet, the goal is likely still unclear.
Turning product goals into clear KPIs
Once success is defined, goals need to be translated into KPIs that can be observed and tracked. A KPI connects intention to reality. It shows how a team knows whether progress is happening and when a decision should change.
Effective KPIs are specific and tied to behavior or outcomes the team can influence. A goal like improving user satisfaction may translate into retention, feature adoption, or NPS, depending on the context. Choosing one forces clarity. It also reveals what the team believes truly represents success for that goal.
In case studies, KPIs do more than report results. They explain priorities. Picking one KPI over another signals what tradeoff the team accepted. This makes reasoning visible to reviewers and interviewers. Weak case studies often list many KPIs without explaining why they matter. Strong ones show how a small set of KPIs guided decisions and limited distractions.[2]
Distinguishing leading and lagging indicators in a case study


Not all metrics tell a story at the same moment. Some reflect what has already happened, while others hint at what is likely to happen next. Understanding this difference is essential in case studies, where decisions are often made before final results are visible.
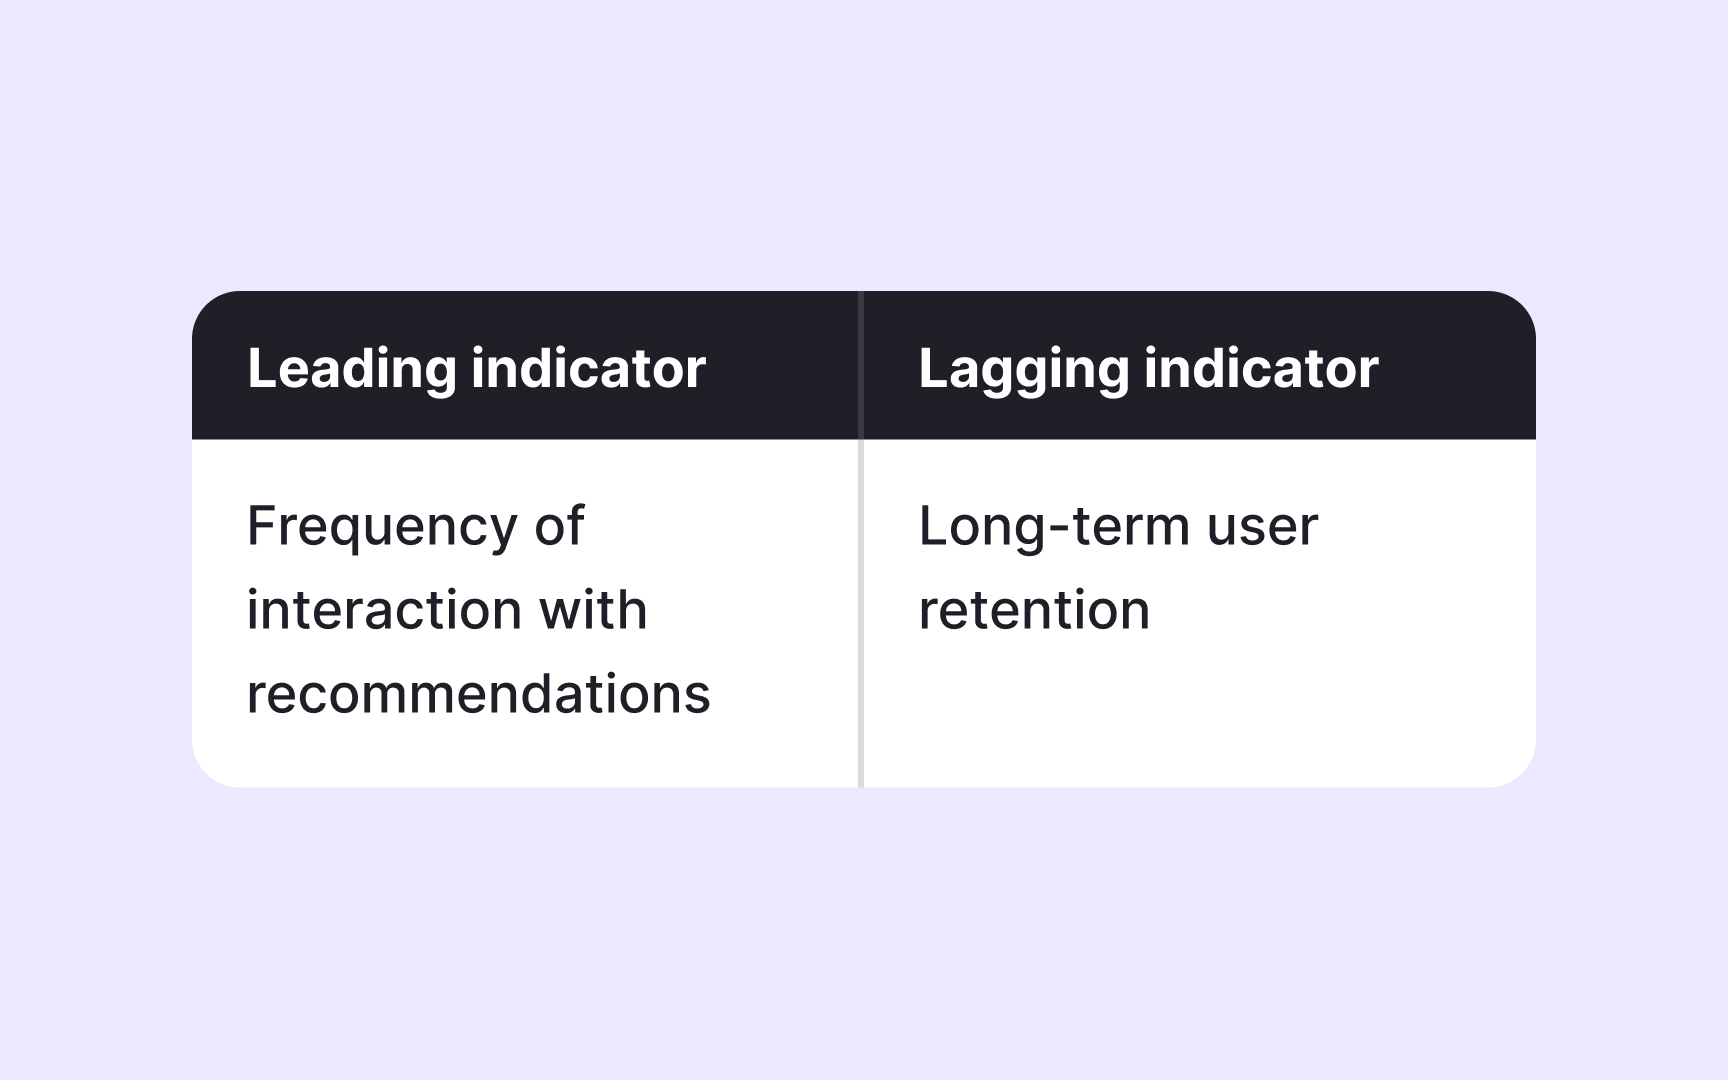
Lagging indicators capture outcomes after the fact. Revenue, churn, or retention rates confirm whether a goal was reached, but they arrive too late to shape day-to-day decisions. They work well for evaluating long-term impact, but they rarely explain how a team adjusted its approach along the way.
Leading indicators appear earlier in the product journey. Engagement with a key feature, completion of an onboarding step, or repeated usage can signal whether a solution is moving in the right direction. In case studies, leading indicators help explain why a team felt confident continuing or changing course before lagging indicators caught up. Showing both types and knowing their roles adds depth to the reasoning
Pro Tip! If a metric only confirms success after launch, pair it with a signal that appears earlier.
Identifying when lagging metrics hide early problems in a case study
Lagging indicators can look healthy while real issues grow underneath. A short-term lift in revenue or engagement may mask rising frustration, declining trust, or damage to other parts of the product. Case studies that rely only on lagging indicators risk telling an incomplete story.
This is where teams look for signals that reveal side effects. A feature that increases usage might also increase load times, support tickets, or drop-offs elsewhere. These early warnings often appear outside the main success metric and are easy to ignore when results look positive.
Strong case studies show awareness of these blind spots. They explain how teams watched for negative signals while chasing a primary goal, and how those signals influenced decisions. This demonstrates responsibility and realism. It also shows that success was not defined narrowly, but balanced against product health and user experience.[3]
Using guardrail metrics to protect product health in a case study
Primary metrics focus attention, but they can also narrow it too much. When teams push hard on a single success signal, other parts of the product may quietly suffer. Guardrail metrics exist to prevent this by tracking what must not get worse while progress is pursued.
A useful way to think about guardrail metrics is driving a car. Speed shows progress toward the destination, but it does not tell whether the car is overheating or running low on fuel. Temperature and fuel gauges do not define success, yet ignoring them can turn a fast trip into a breakdown. Guardrail metrics play the same role by keeping movement safe.
The examples of guardrail metrics include performance, error rates, or engagement in other parts of the product. These signals help teams pause, adjust, or stop before damage spreads.
In case studies, guardrails show maturity. They explain how teams balanced ambition with responsibility and how tradeoffs were managed in practice. Including guardrail metrics makes decisions easier to defend, especially when results are mixed. It shows that success was evaluated in context, not in isolation.[4]
Pro Tip! If progress accelerates, check which indicators would signal that it needs to slow down.
Matching metrics to different problem types in a case study
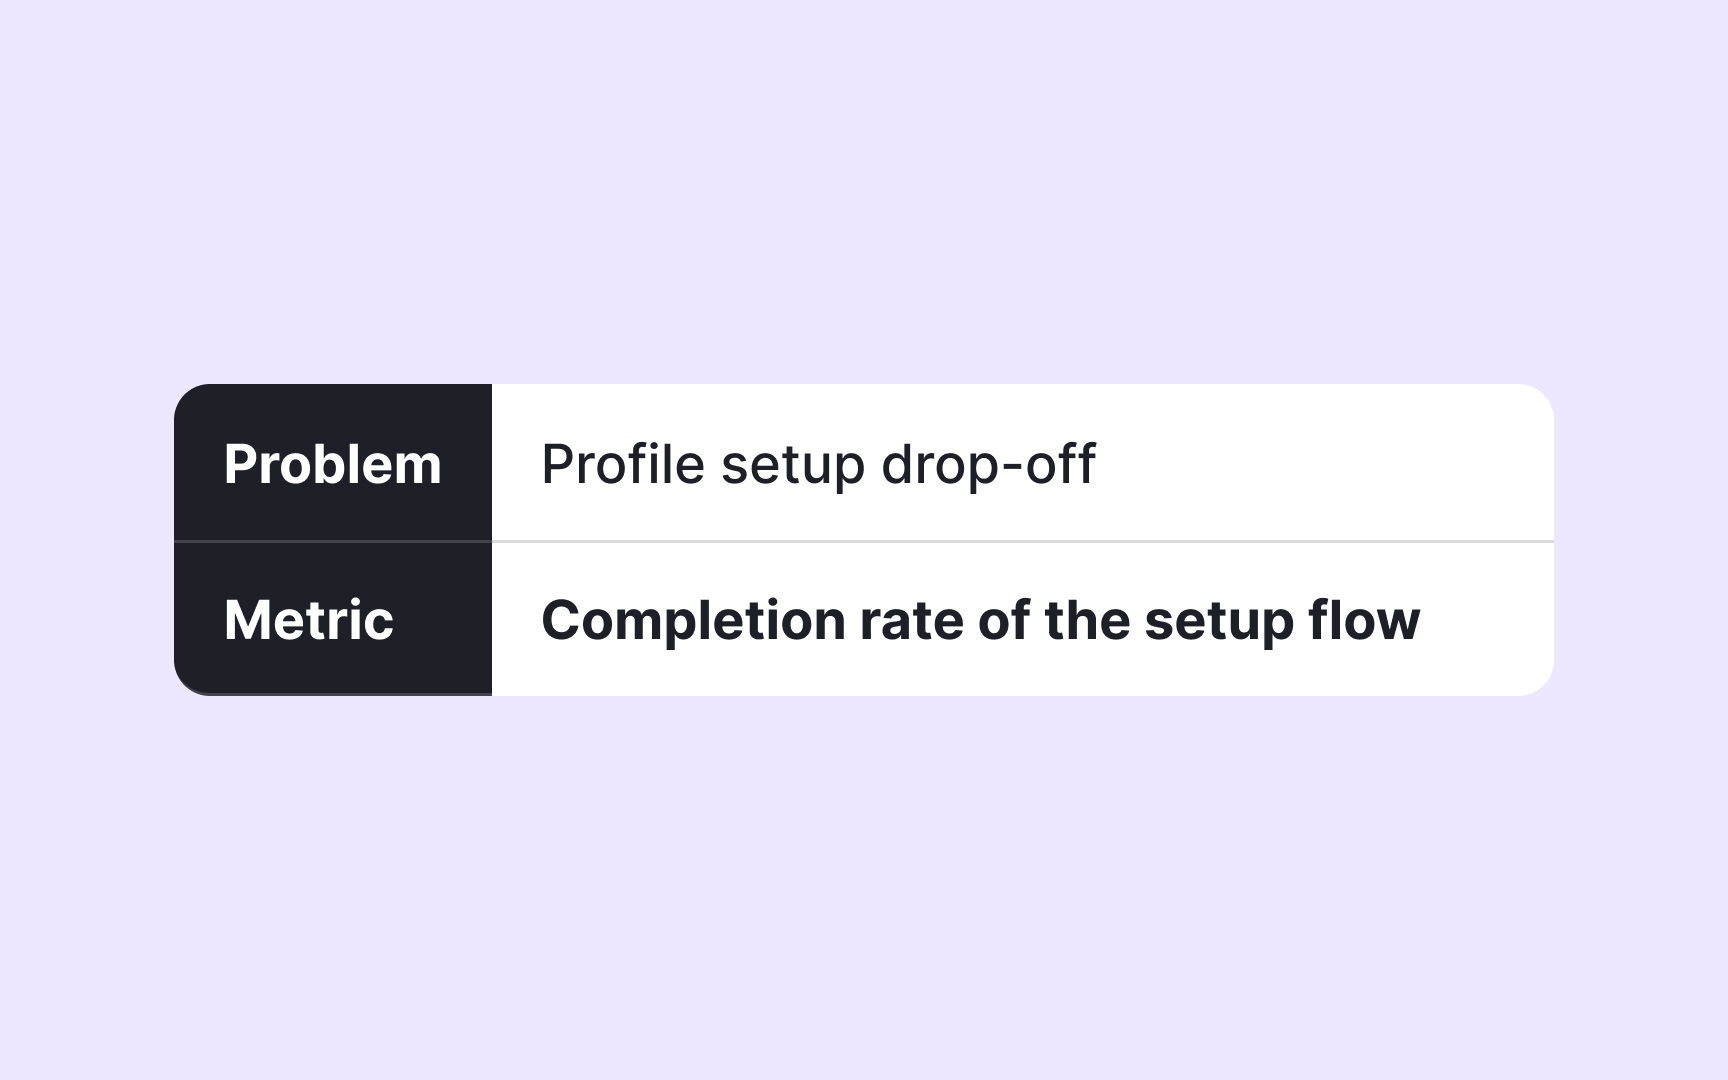
Not every product problem should be measured the same way. A usability issue, a discovery challenge, and a monetization experiment each point to different signs of success. Treating them as interchangeable often leads to misleading conclusions:
- Behavioral problems, such as onboarding friction or feature confusion, are best measured through activation, task completion, or repeated use.
- Growth problems often rely on acquisition, retention, or engagement patterns.
- Monetization problems are best evaluated through revenue-related metrics, which reflect financial impact but offer limited insight into early usability or understanding.
Strong case studies make this match explicit. They show that metrics were chosen because of the problem being solved, not because they were standard or easy to report. This clarity helps reviewers see that the solution followed the problem, rather than metrics shaping the story after the fact.[5]
Pro Tip! If a metric feels impressive but unrelated to the problem, it likely belongs to a different question.
Spotting vanity metrics in case study claims
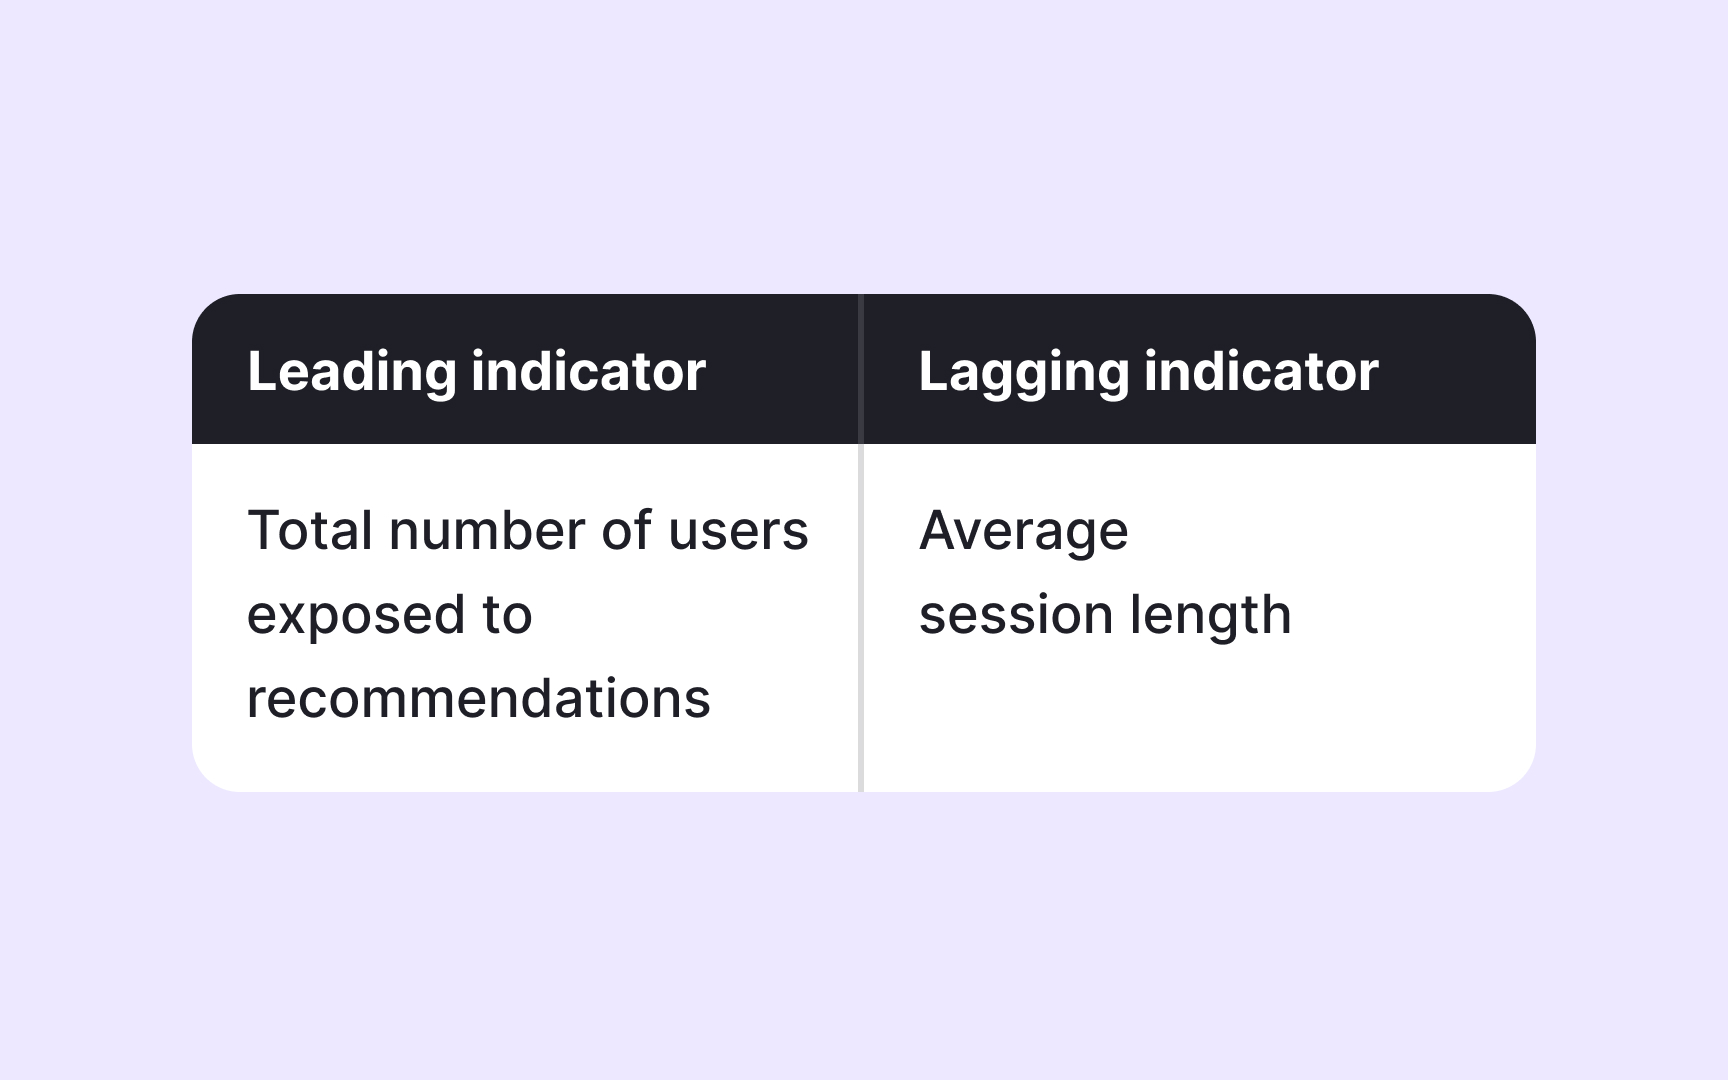
Vanity metrics are numbers that look impressive but do not reflect meaningful progress or inform decisions. They often grow easily, sound positive, and feel safe to report, yet they fail to show whether users actually benefit from the product or whether a problem was solved.
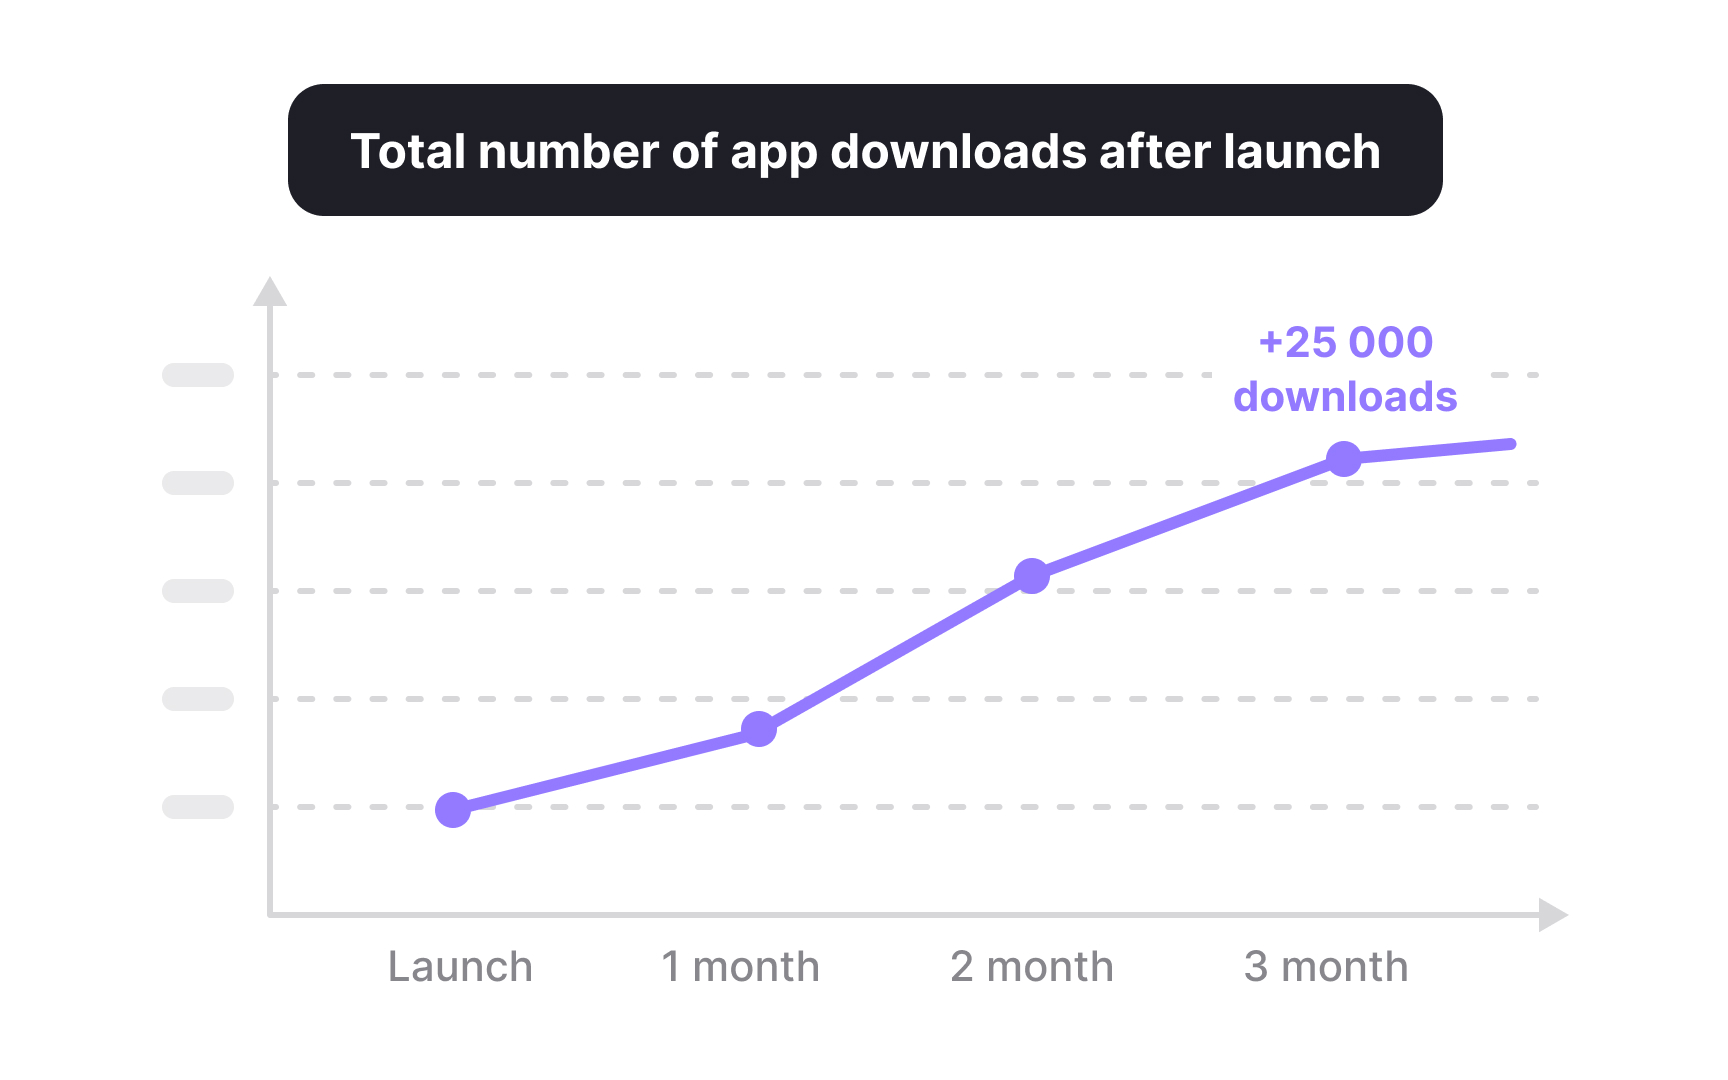
Common examples include raw page views, total sign-ups, or download counts without follow-up behavior. These metrics describe exposure or activity at a surface level, not impact. A rise in traffic does not confirm better onboarding, and more registrations do not guarantee retention or satisfaction.
In case studies, vanity metrics can make outcomes appear stronger than they are. Strong case studies question attractive numbers and replace them with signals tied to real behavior, such as activation after sign-up or continued use over time. This shows that success was measured by meaningful change rather than visibility alone.[6]
Pro Tip! If a metric only answers “how many” but not “so what,” it is likely a vanity metric.
Showing tradeoffs through metric selection in a case study
Every metric highlights one outcome while pushing others into the background. Choosing what to measure is already a decision, and that decision carries tradeoffs. Case studies become stronger when this tension is visible rather than hidden.
For example, focusing on engagement can increase time spent but may reduce trust or long-term satisfaction. Prioritizing speed to launch may improve delivery metrics while increasing defects or support issues. Metrics make these choices explicit by showing what the team protected and what it was willing to risk.
Clear case studies do not pretend that one metric tells the full story. They explain why certain metrics were prioritized and which downsides were monitored as a result. This demonstrates realistic product thinking and signals that decisions were made with awareness of costs, not just benefits.[7]
Stress-testing success metrics for unintended impact
A metric can signal success while quietly causing harm elsewhere. Stress-testing means asking what might break if a metric keeps improving and which signals would reveal that damage early.
This practice often involves pairing a primary metric with secondary checks. A rise in engagement might be tested against performance or user trust. Faster delivery may be checked against defect rates or support volume. These additional signals help teams understand whether progress is sustainable or fragile.
In case studies, stress-testing metrics show responsibility. It proves that teams did not chase wins blindly and were prepared to pause or adjust if costs became too high. This approach strengthens credibility by showing that success was evaluated under pressure, not only in ideal conditions.
Pro Tip! If a metric doubled overnight, ask which signal would tell you to stop celebrating.
Topics
References
- Picking the Right Product Metrics to Track and Optimize | Heap
- Product management KPIs | Atlassian
- Guardrail metrics: The complete guide to balanced product growth | Signals & Stories | Mixpanel
- Guardrail metrics: The complete guide to balanced product growth | Signals & Stories | Mixpanel
- Picking the Right Product Metrics to Track and Optimize | Heap
- Quick read: Best practices for picking product metrics | Mind the Product
- Great PM Interview Answers Include Tradeoffs. Here's How. - Exponent | Exponent