Financial metrics reveal whether a product business model works. Without tracking revenue patterns, companies burn through funding without knowing if they can sustain operations or achieve profitability. Revenue metrics provide the financial foundation for making strategic decisions about pricing, market expansion, and resource allocation. Annual recurring revenue and monthly recurring revenue measure predictable income streams from subscriptions, helping teams forecast cash flow and plan investments. Lifetime value shows whether customers generate enough revenue to justify acquisition costs. Total addressable market sizes the revenue opportunity, determining whether markets are large enough to support growth ambitions. Gross margin reveals how much revenue remains after delivering the product, indicating operational efficiency. These metrics connect product decisions to business outcomes. Teams use them to evaluate pricing strategies, identify sustainable growth patterns, and communicate financial health to stakeholders. Understanding these measurements enables product managers to balance user needs with business viability, ensuring products don't just solve problems but generate sustainable revenue. Strong revenue metrics signal healthy business models that can scale profitably over time.
Annual recurring revenue (ARR)
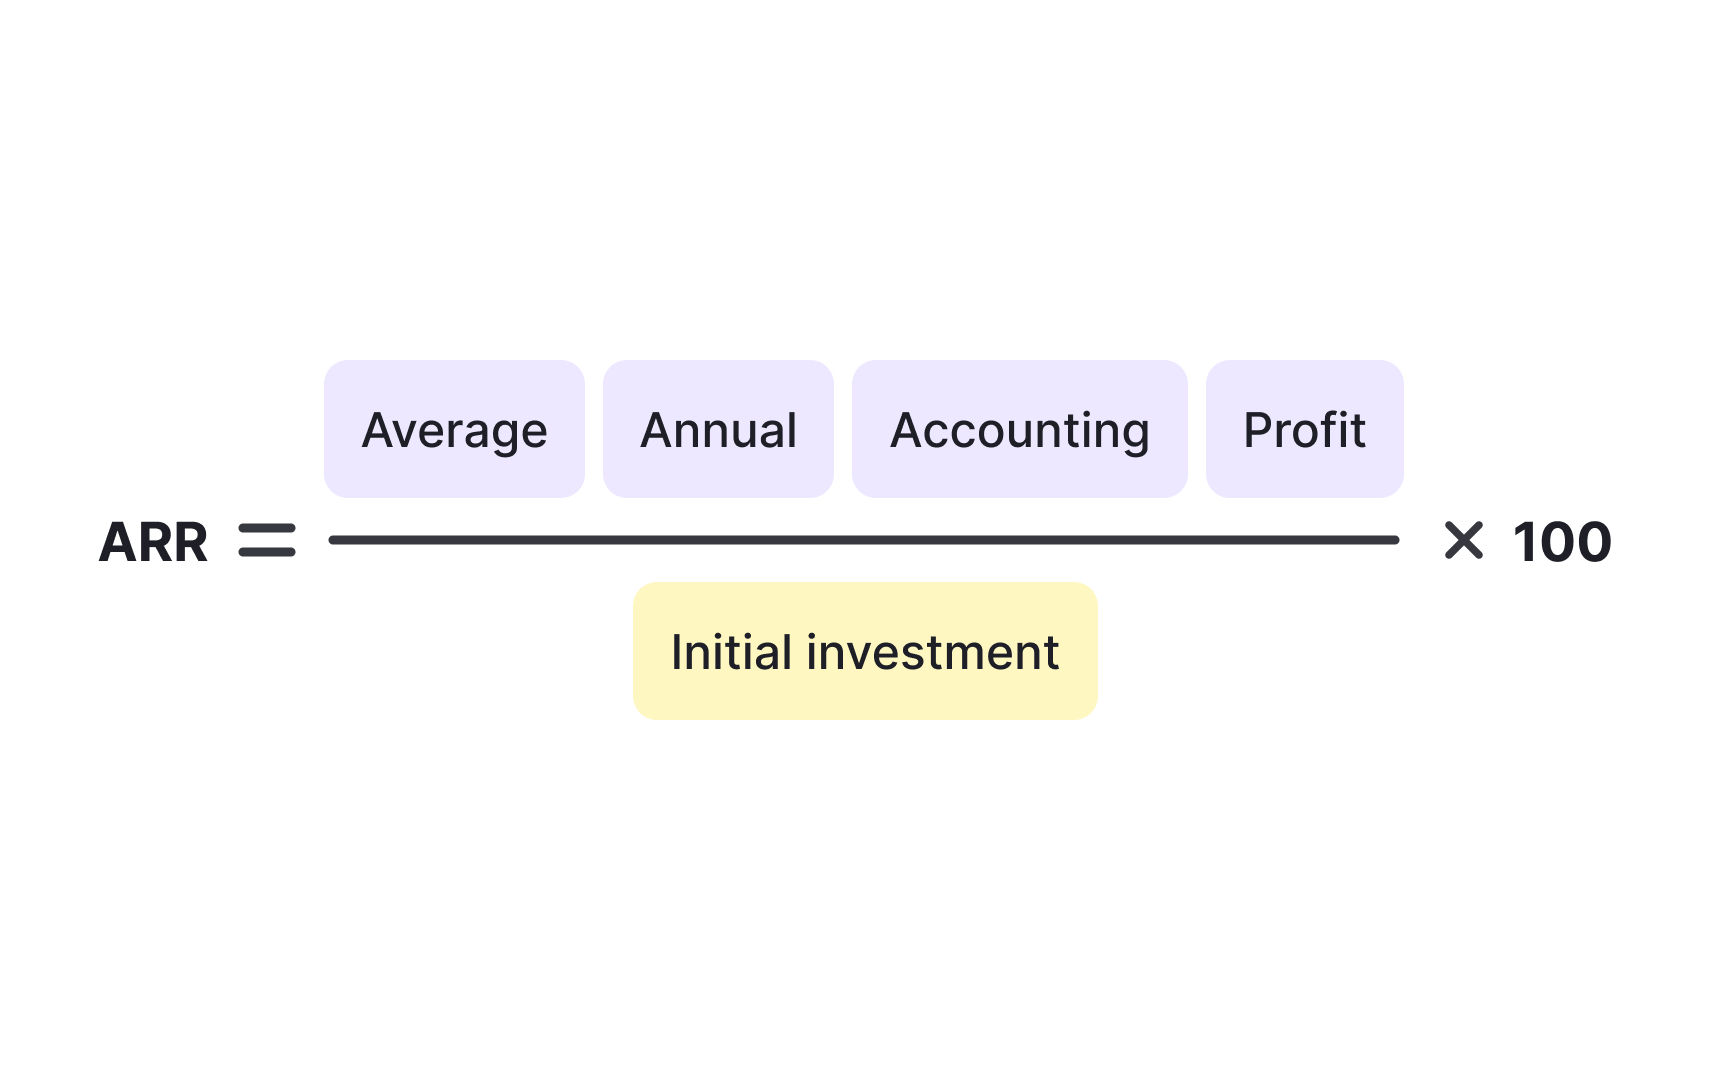
Annual recurring revenue (ARR) measures the value of recurring revenue that a subscription business expects to generate over one year, normalized from existing contracts. It provides a snapshot of predictable annual income from subscriptions at a specific point in time.
ARR is calculated using this formula: Total revenue of yearly subscriptions + Total revenue gained from add-ons and upgrades - Total revenue lost due to downgrades, cancellations, and churn.
For example, if a company has $10 million in annual subscriptions, gains $2 million from upgrades, and loses $1 million to churn, the ARR is $11 million.
ARR focuses exclusively on recurring subscription revenue, excluding one-time fees like setup charges or professional services. Teams track ARR movements to understand what drives revenue changes: new customers, expansion from existing customers, contraction from downgrades, or losses from churn. Investors use ARR as a primary valuation metric because it signals business stability and growth potential. A company growing ARR at 50% annually demonstrates strong market demand and product-market fit. Product teams use ARR to justify investment decisions, showing how new features or market expansions could impact annual revenue.
ARR works best for businesses with annual contracts or multi-year agreements. Companies with primarily monthly subscriptions often track Monthly Recurring Revenue instead, though many use both metrics for different purposes.[1]
Monthly recurring revenue (MRR)
Monthly recurring revenue (MRR) measures the predictable revenue a subscription business generates each month from active subscriptions. It normalizes all recurring revenue to a monthly amount, providing a consistent metric for tracking short-term growth. For example, annual subscriptions of $1,200 are counted as $100 MRR ($1,200 ÷ 12).
MRR excludes one-time charges like setup fees or variable usage fees, focusing solely on predictable monthly subscription income. This makes it ideal for operational decision-making since expenses typically occur monthly. Teams track MRR components, including new MRR from new customers, expansion MRR from upgrades, contraction MRR from downgrades, and churned MRR from cancellations.
Product teams use MRR for month-to-month planning because it reveals trends faster than annual metrics. A sudden MRR drop might indicate a product issue or competitor threat that requires immediate attention. Marketing teams use MRR to measure campaign effectiveness, tracking how quickly new customer revenue grows. MRR works best for businesses with monthly billing or mixed subscription terms. It provides more granular visibility than ARR, helping teams spot problems and opportunities earlier. Many companies track both MRR for operations and ARR for strategic planning and investor communications.[2]
Pro Tip! Compare MRR growth rate to customer count growth to see if revenue increases come from more customers or higher value per customer.
Lifetime value (LTV)
Lifetime value (LTV), also called customer lifetime value (CLV), estimates the total revenue a business expects to generate from a customer throughout their entire relationship. It helps teams understand whether customer acquisition investments will pay off over time. For example, if customers spend $100 monthly and stay for 3 years on average, their LTV is $3,600.
The basic LTV formula multiplies average revenue per user by gross margin, then divides by churn rate. This calculation balances revenue generation against costs and customer retention. A higher LTV means customers generate more value, justifying higher acquisition spending.
Product teams use LTV to prioritize features for high-value customer segments. If enterprise customers have 10 times higher LTV than small business customers, the product roadmap should reflect that difference. Marketing teams compare LTV to customer acquisition cost (CAC) to ensure sustainable growth. The ideal LTV to CAC ratio is 3:1, meaning customers generate 3 times more revenue than acquisition costs.
LTV helps identify which customer segments are most profitable. Teams might discover that customers acquired through referrals have 50% higher LTV than paid ad customers, indicating where to focus growth efforts. Understanding LTV prevents the trap of acquiring customers who don't generate enough revenue to cover their costs.[3]
Pro Tip! Calculate LTV separately for different customer segments to identify which types of customers are actually profitable.
Total addressable market (TAM)
Total addressable market (TAM) represents the maximum revenue opportunity available if a product captured 100% market share. It sizes the entire potential market without considering competition or practical limitations. For example, if 30 million businesses could potentially use project management software at $1,000 annually, the TAM is $30 billion. Teams calculate TAM using 3 approaches:
- Top-down analysis starts with broad market research and narrows to specific segments.
- Bottom-up analysis multiplies the target customer count by the average revenue per customer.
- Value theory estimates what customers would pay based on the value delivered. Each method provides different perspectives on market size.
TAM helps teams evaluate whether opportunities are worth pursuing. A $10 million TAM might not justify significant investment, while a $10 billion TAM could support multiple competitors. Investors use TAM to assess growth potential and determine whether markets are large enough for meaningful returns. Product teams use TAM to prioritize market expansions. If the TAM for enterprise customers is 10 times larger than the TAM, the long-term strategy should reflect that difference. TAM calculations also reveal when markets are too small to support sustainable businesses, helping teams avoid dead-end opportunities before investing significant resources.[4]
Pro Tip! Calculate TAM for different market segments separately to identify which expansion opportunities offer the largest revenue potential.
Gross margin
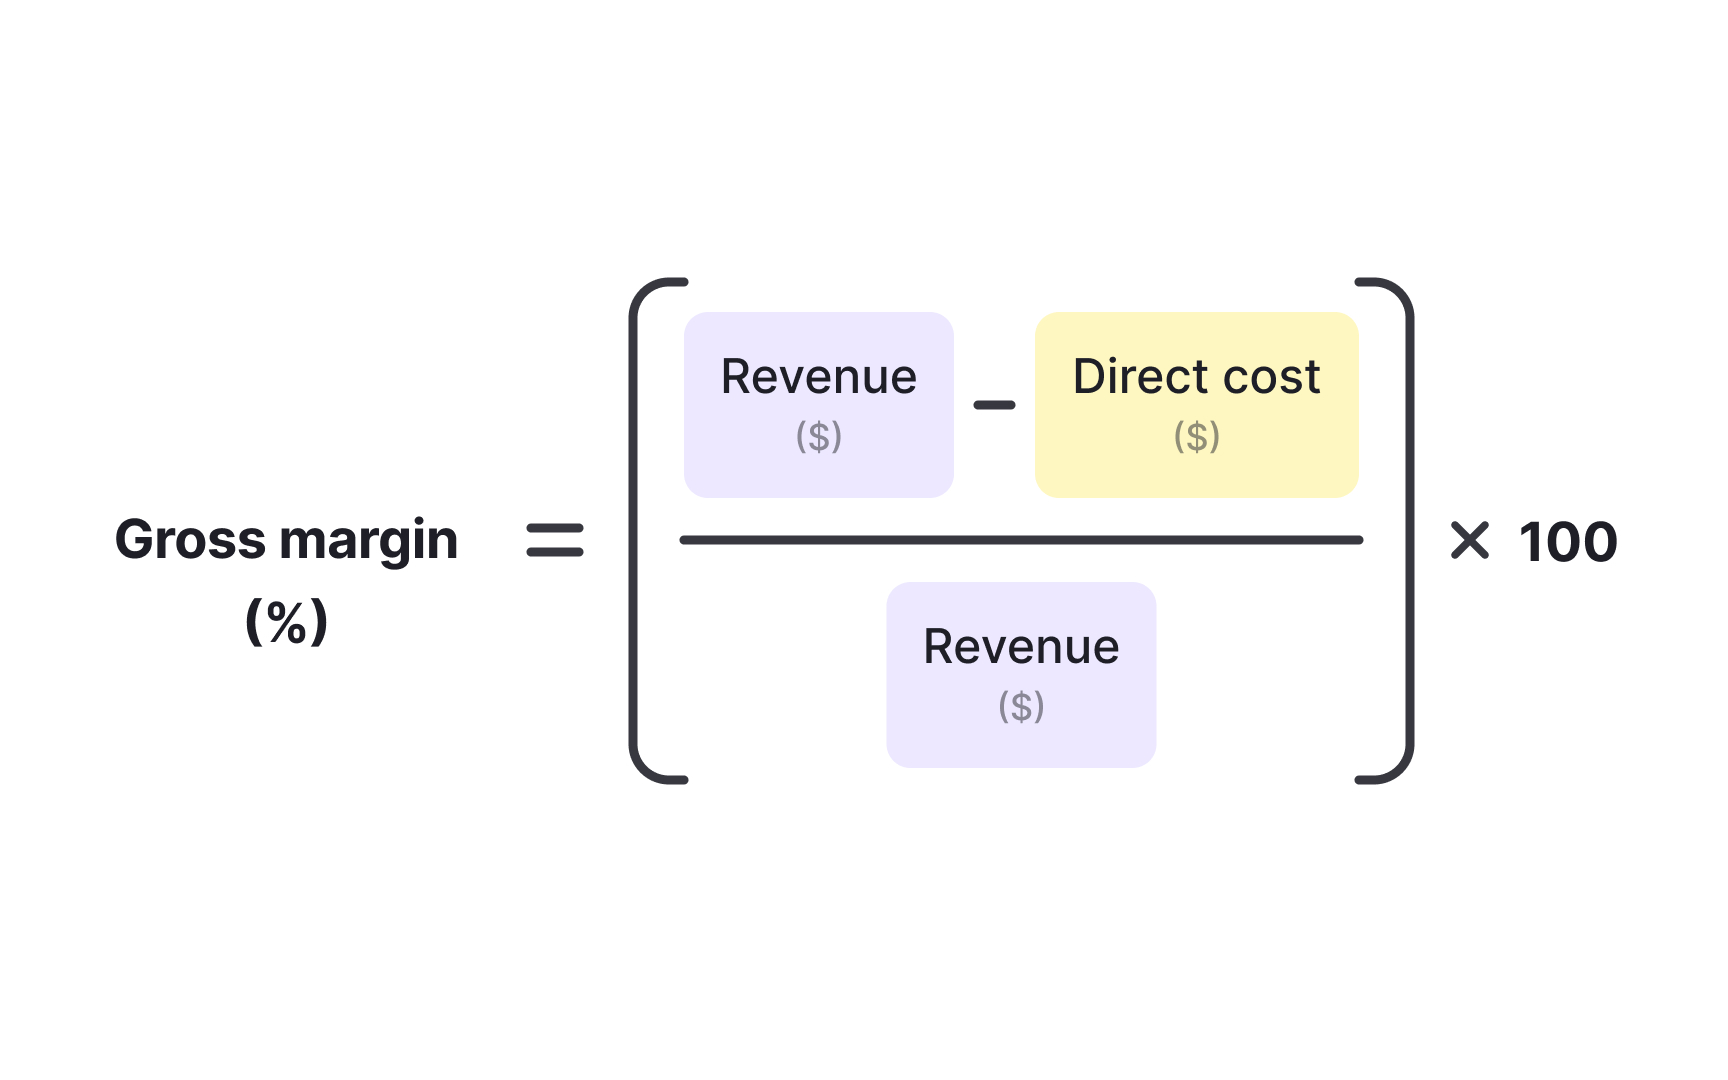
Gross margin is the percentage of revenue remaining after subtracting the direct costs of delivering a product or service. It reveals how efficiently a business converts sales into profit before accounting for operating expenses. For example, if a SaaS product generates $1 million in revenue with $200,000 in server and support costs, the gross margin is 80%.
For subscription businesses, gross margin typically includes costs like hosting infrastructure, customer support, and payment processing fees. Higher gross margins mean more money available for growth investments like sales, marketing, and product development. Software businesses often achieve 70-90% gross margins because incremental customers cost relatively little to serve.
Product teams use gross margin to evaluate pricing strategies and cost structures. If gross margin drops from 80% to 60%, teams investigate whether hosting costs increased or whether discounting eroded pricing power. Low gross margins limit how much companies can spend on customer acquisition while remaining profitable. Investors expect SaaS businesses to maintain high gross margins as they scale. Declining gross margins might indicate operational inefficiencies or unsustainable pricing. Product managers balance feature development costs against margin impact, ensuring new capabilities don't require expensive infrastructure that reduces profitability. Strong gross margins provide the financial foundation for sustainable growth.[5]
Pro Tip! Monitor gross margin by customer segment to identify which types of customers are expensive to serve relative to their revenue.
Average Revenue Per User (ARPU)
Average revenue per user (ARPU) measures the average revenue generated per customer over a specific time period, typically monthly or annually. It reveals how much value each customer contributes to the business. For example, if a SaaS company generates $500,000 monthly revenue from 5,000 customers, the monthly ARPU is $100.
ARPU is calculated by dividing total recurring revenue by the number of active customers for that period. Teams track ARPU to understand pricing effectiveness and customer value trends. Rising ARPU indicates successful upsells, premium tier adoption, or price increases. Declining ARPU might signal customers downgrading, increased discounting, or shifts toward lower-value customer segments.
Product teams use ARPU to evaluate pricing strategies and feature packaging. If enterprise customers have an ARPU of $500 while small businesses average $50, product roadmaps should reflect that 10x value difference. Marketing teams segment campaigns by ARPU to focus acquisition spending on higher-value customer profiles. ARPU connects directly to other revenue metrics. It's a key component in calculating LTV and helps explain MRR or ARR changes. Teams compare ARPU across customer segments, acquisition channels, and time periods to identify which strategies drive the most valuable customer relationships.