



.svg)

Knowing what a customer costs to acquire only tells half the story. The other half is how much revenue a customer generates over the relationship. Customer lifetime value, or LTV, is the metric that answers this, and without it, customer acquisition cost has no context. Spending 500 euros to acquire a customer looks rational if they generate 5,000 euros over time.
LTV is not a single formula. Subscription businesses track monthly churn to estimate how long customers stay and multiply that by their monthly contribution. Transactional businesses look at purchase frequency, average order value, and gross margin. Both approaches require using real data, not optimistic assumptions, to produce numbers you can act on.
The components that drive LTV are not equal in their leverage. For subscription businesses, churn rate dominates. The difference between 1% and 3% monthly churn is a 3x swing in average customer lifetime and a corresponding swing in LTV. For transactional businesses, repeat purchase behavior is the equivalent lever. Understanding which lever matters most in your business model is where improvement begins.
What customer lifetime value measures
Customer lifetime value is the total revenue a customer generates over their relationship with a business, adjusted for the cost of serving them. The word "total" matters here. LTV is not what a customer pays this month or this year. It is the sum of all contributions across the full duration of their relationship, minus the direct costs of delivering that value.
This matters because it reframes how you think about acquisition. A founder who sees acquisition cost as an expense is looking at one side of a ledger. A founder who understands LTV sees it as an investment with a defined expected return. A marketing manager at a project management software company might justify spending 1,200 euros to acquire a customer once they know that the customer typically generates 6,000 euros over 3 years. Without that context, the same spend looks arbitrary.
LTV also disciplines retention decisions. If each churned customer represents 6,000 euros in lost projected value, investing 200 euros in a customer success call to prevent that churn is a clear decision rather than a cost to minimize. The metric does not just tell you how much customers are worth. It tells you how much their departure costs.[1]
Subscription LTV formula

For businesses with recurring revenue, LTV is calculated from 3 components:
- Average revenue per user (ARPU)
- Gross margin removes the direct cost of serving each customer, covering hosting, support, and infrastructure
- The monthly churn rate determines how long the average customer stays, and dividing 1 by that rate gives you the average customer lifetime in months.
The formula is: LTV equals ARPU multiplied by gross margin, multiplied by 1 divided by the monthly churn rate. A software company with 200 euros ARPU, 75% gross margin, and 2% monthly churn produces: 200 times 0.75 times 50, which equals 7,500 euros per customer. The same company at 4% monthly churn produces 3,750 euros. Doubling the churn rate cuts LTV in half.
Gross margin matters because it separates revenue from value. A customer generating 200 euros per month but costing 80 euros to serve contributes 120 euros, not 200. Building LTV on gross margin rather than revenue produces numbers that reflect the actual economics of the relationship, not just the invoice total.
Churn rate matters because it is the only component of the formula that determines how long the customer contributes at all. ARPU and gross margin set the value of each month. Churn rate decides how many of those months you actually get.[2]
Transactional LTV formula
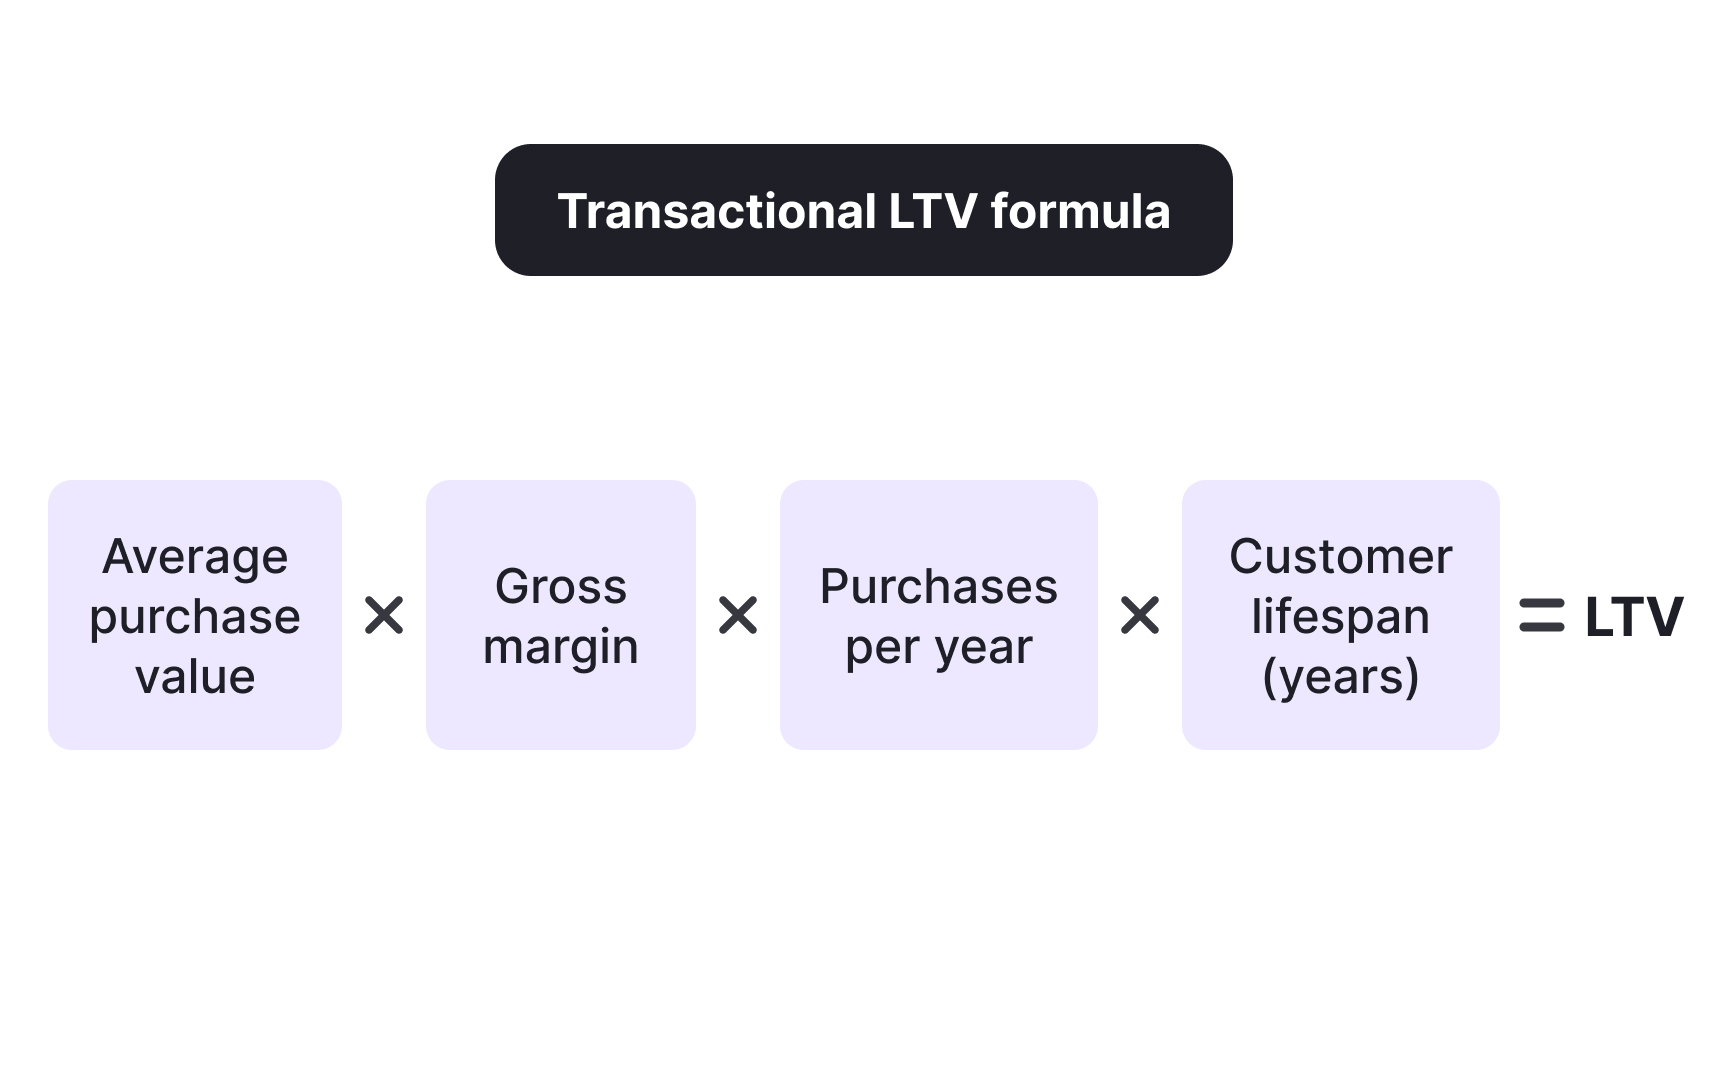
Businesses that sell through individual transactions calculate LTV differently because there is no churn rate to work with. Instead, the formula relies on 3 observable behaviors:
- how much customers spend per purchase
- How often they return
- How long they remain active buyers.
The formula is: LTV equals average purchase value multiplied by gross margin, multiplied by purchases per year, multiplied by customer lifespan in years. A home goods retailer with a 120-euro average order, 40% gross margin, 2.5 purchases per year, and a 3-year customer lifespan produces: 120 times 0.4 times 2.5 times 3, which equals 360 euros per customer.
Repeat purchase behavior dominates LTV in transactional businesses. A customer who buys once at 120 euros with 40% gross margin contributes 48 euros. A customer who makes the same purchase 7 times over 3 years contributes 336 euros. The per-transaction economics are identical. The LTV is 7 times higher. This is why e-commerce businesses invest in loyalty programs and post-purchase re-engagement: the difference between a one-time buyer and a repeat buyer is the difference between a marginally profitable customer and one who sustains the business.[3]
Churn rate as the dominant LTV lever
Churn rate is the most powerful variable in the LTV calculation for subscription businesses, yet founders routinely underestimate its impact because the difference between churn percentages looks small. It is not small in practice.
At 1% monthly churn, the average customer lifetime is 100 months. At 2%, it is 50 months. At 5%, it is 20 months. For a SaaS company with 300 euros of Average revenue per user (ARPU) and 80% gross margin, this produces LTV figures of 24,000 euros, 12,000 euros, and 4,800 euros, respectively. The difference between 1% and 5% monthly churn is a 5x difference in lifetime value, driven entirely by how long customers stay.
This relationship has a practical implication: reducing churn by even one percentage point often creates more value than a comparable increase in acquisition spend. A customer success lead who reduces monthly churn from 3% to 2% across 500 accounts at 300 euros ARPU and 80% gross margin has increased total LTV from 12 million euros to 18 million euros without acquiring a single new customer. One change in retention performance, no new spend. This is the leverage that makes churn the most closely watched metric in subscription businesses.[4]
Pro Tip! Before investing in acquisition, check your churn rate first. Reducing it by 1% often creates more value than doubling your marketing budget.
Segment-level LTV analysis
Calculating a single LTV number averaged across all customers conceals information that matters for strategy. Breaking LTV down by customer segment reveals which segments are creating value and which are consuming resources without proportionate return. Enterprise customers typically generate higher monthly revenue, churn at lower rates because switching costs are high, and expand usage over time by adding seats or usage volume. These characteristics combine to produce an LTV that is often 5 to 10 times higher than smaller segments. Small and medium-sized business (SMB) customers tend to churn at higher rates, expand less, and generate lower monthly revenue.
A SaaS company calculating only blended LTV might conclude its business is healthy. Breaking that number into enterprise and SMB segments might reveal enterprise customers at 40,000 euros LTV and SMB customers at 3,000 euros LTV. A product manager reviewing this analysis could justify shifting sales resources toward enterprise acquisition, even at higher CAC, because the resulting LTV clears the minimum viability threshold in a way the SMB segment does not. Segment analysis is what turns LTV from a dashboard number into a decision-making tool.[5]
Common LTV calculation mistakes
Several calculation errors consistently inflate LTV, producing decisions that look rational but fail when tested against reality:
- Ignoring churn is the most common error. Calculating LTV as if customers stay indefinitely produces dramatically overstated numbers. Every subscription business has churn, and even 0.5% monthly churn implies a 200-month average customer lifetime. If churn is not in the formula, the output is not a business metric.
- Using revenue instead of gross margin overstates LTV by the full cost of serving each customer. If gross margin is 65%, LTV calculated on revenue inflates the true value contribution by 35%. For capital allocation decisions, this difference is significant.
- Projecting LTV further than your data supports is also a mistake. A two-year-old company projecting LTV over 7 years is using assumptions with no empirical basis. Use the shortest reliable period from actual cohort data, and present longer projections as scenarios rather than conclusions. Conservative LTV estimates that hold up are more useful than optimistic ones that collapse the first time someone checks the underlying assumptions against real customer behavior.[6]
Expansion revenue and net revenue retention
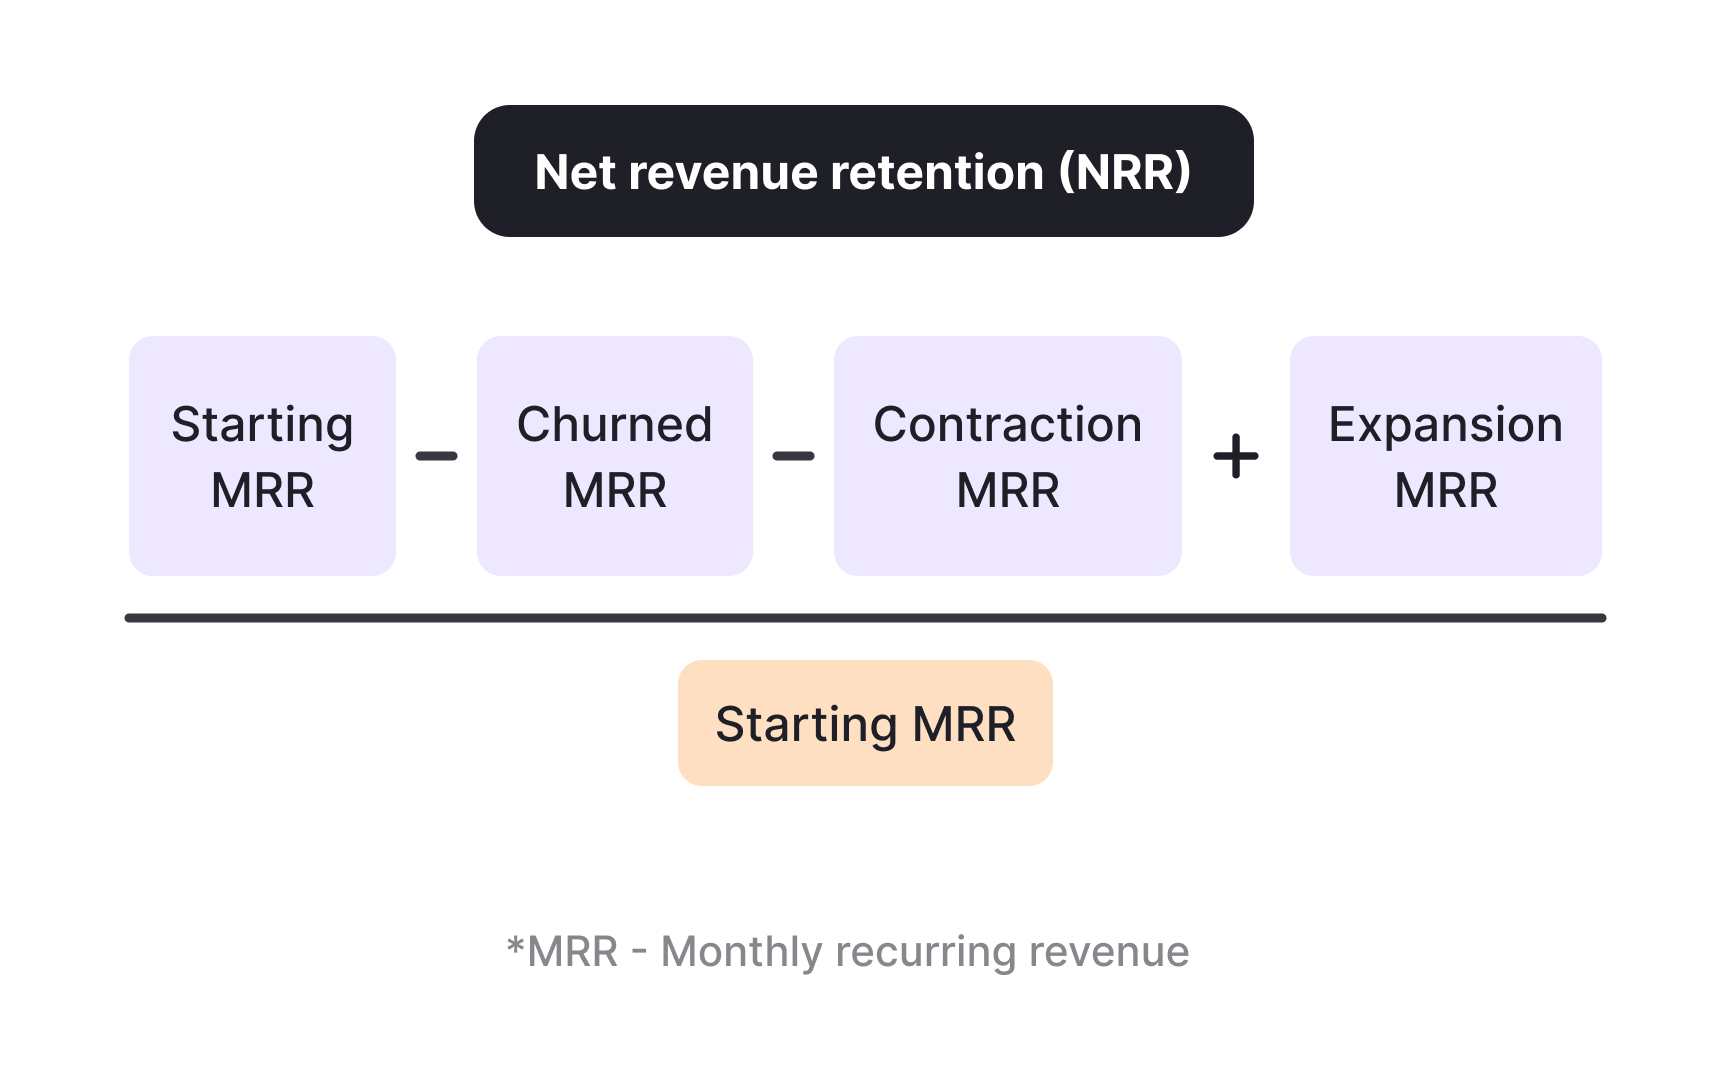
Expansion revenue is income generated when existing customers increase their spending over time. It includes upgrades to higher plans, additional seats, growing usage volume, and purchases of adjacent products. In healthy subscription businesses, expansion partially offsets churn and raises effective LTV above what the base formula predicts.
A customer who starts at 200 euros per month and expands to 350 euros over 2 years contributes more lifetime value than the initial ARPU suggests. If 30% of the customer base expands meaningfully, blended LTV rises without changes to acquisition strategy or reductions in churn. This is why growth teams track net revenue retention (NRR) alongside gross revenue retention. Gross retention tells you what proportion of revenue you keep from the previous period. Net retention tells you what proportion you keep after accounting for both churn and expansion. An NRR above 100% means expansion more than offsets losses from churned customers. A revenue operations lead tracking NRR above 110% has evidence that the product is creating compounding value for the customer base it already has, without requiring new customers to sustain revenue growth.[7]
Pro Tip! NRR above 100% is one of the strongest signals investors look for in a subscription business. It means the customer base grows in value on its own.
LTV by acquisition channel
LTV varies not just by customer segment but by the channel through which customers were acquired. This distinction has direct implications for how marketing budgets should be allocated and how CAC targets should be set per channel.
Organic channels, such as content marketing and search engine optimization, tend to produce customers with higher LTV than paid acquisition channels. These customers often arrive with a stronger understanding of the product's value, lower price sensitivity, and lower churn rates. A growth marketer analyzing LTV by channel might find that organic search customers have an LTV of 8,000 euros while paid social customers have an LTV of 3,500 euros. This finding changes the economic justification for channel investment. The company might rationally accept a higher CAC for organic customers because the resulting LTV ratio remains healthy. The same CAC applied to paid social customers might not clear the minimum threshold. Without channel-level LTV, both channels appear equivalent. With the breakdown, the marketing team can start allocating budgets based on which acquisition sources are actually building long-term business value.[8]
Pro Tip! Segment LTV by acquisition channel before setting CAC targets. One target across all channels will overspend on some and underspend on others.
Topics
References
- Customer Lifetime Value (CLV or LTV) Formula: How to Calculate It Correctly - InnerTrends | InnerTrends
- LTV/CAC Ratio | SaaS Formula + Calculator | Wall Street Prep
- How To Calculate Customer Lifetime Value (2025) - Shopify | Shopify
- The Customer Lifetime Value Calculation For SaaS Companies
- LTV Calculation SaaS: Understand Customer Value and Grow Smarter
- How to Calculate Customer Lifetime Value (CLTV) - The SaaS CFO | The SaaS CFO
- Customer Lifetime Value (CLV or LTV) Formula: How to Calculate It Correctly - InnerTrends | InnerTrends