Product success requires more than intuition. The right metrics reveal what's working, what needs attention, and where to invest resources. Without clear measurement, teams make decisions based on guesses rather than evidence, leading to wasted effort and missed opportunities. Core product metrics provide objective indicators of product health, user behavior, and business performance. Customer acquisition cost reveals the efficiency of growth efforts, showing exactly what teams spend to gain each new user. Retention matters more than acquisition for long-term success because keeping existing customers costs less than constantly replacing churned ones. Churn identifies where products lose users and why they leave. Product adoption measures initial usage patterns, revealing whether users successfully integrate the product into their workflows. Net Promoter Score captures customer satisfaction through recommendation likelihood. Some metrics look impressive but fail to drive real decisions, creating false confidence about product health.
These measurements form the foundation for data-driven product management, helping teams focus on what actually matters rather than what merely looks good. Understanding these metrics enables teams to track progress, spot problems early, and communicate product health clearly to stakeholders.
Customer acquisition cost (CAC)
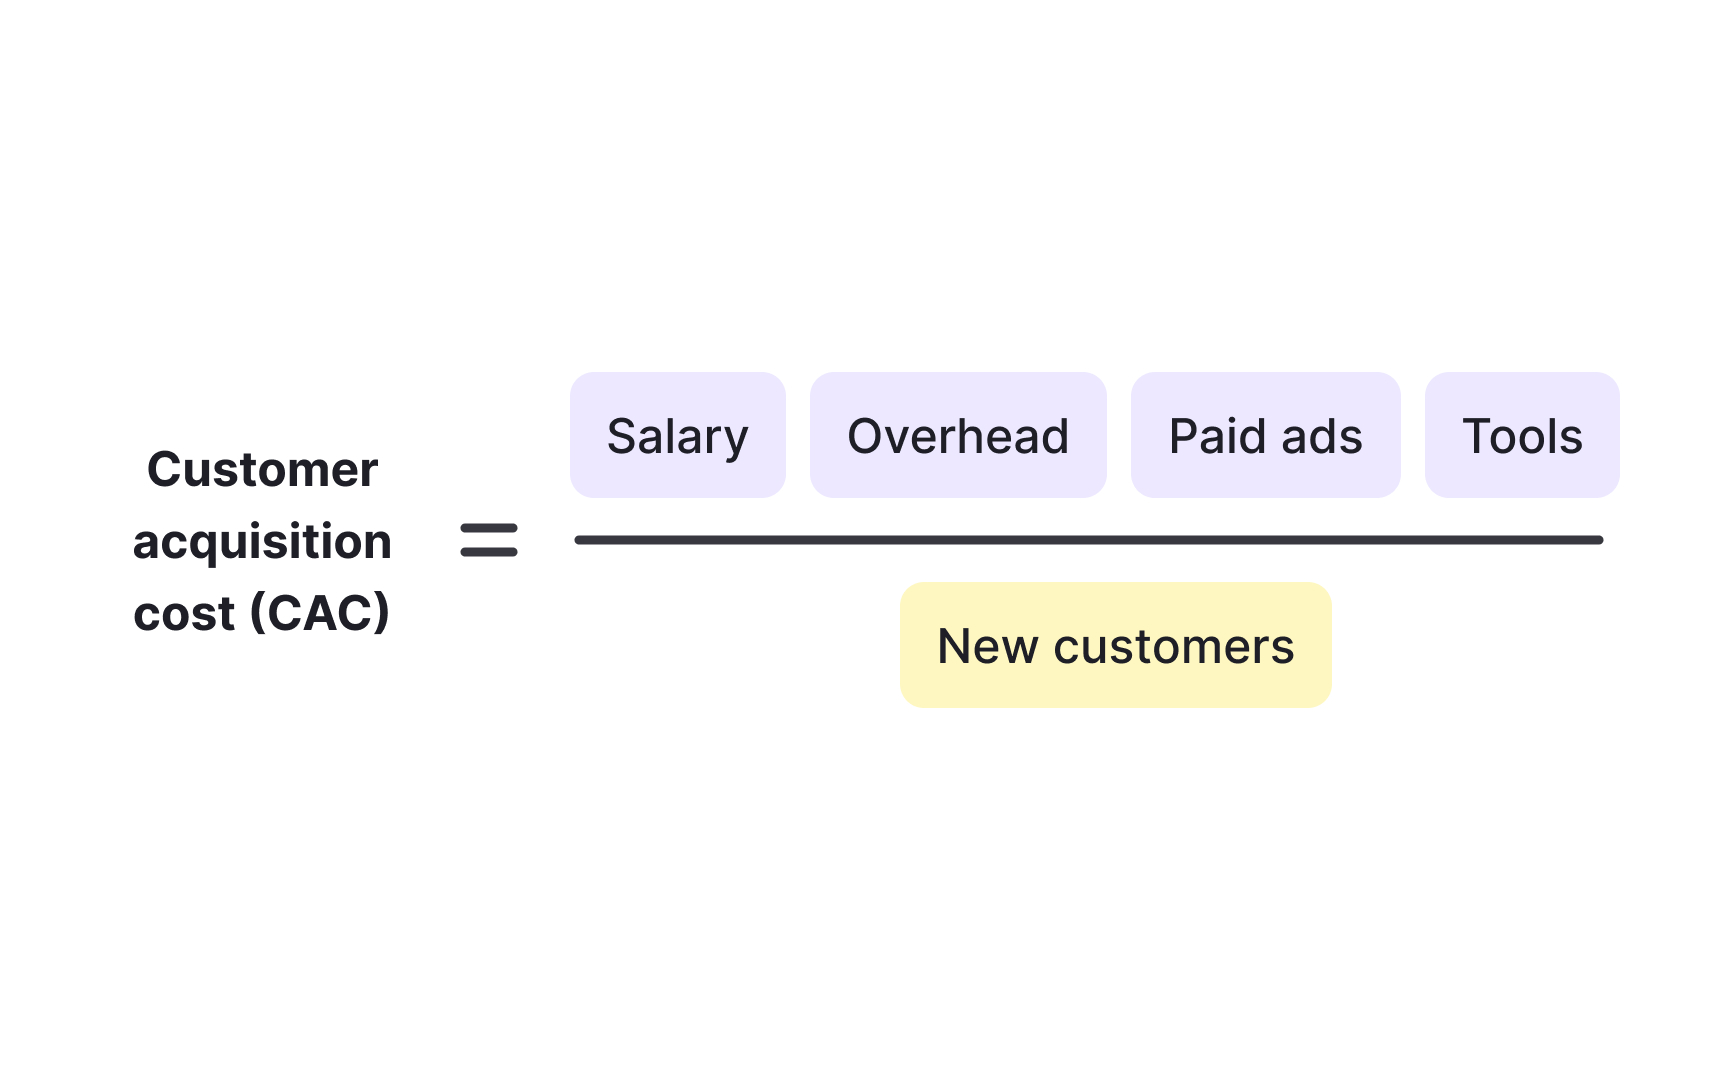
Customer acquisition cost (CAC) measures the total expense of gaining one new customer, calculated by dividing all sales and marketing costs by the number of new customers acquired in that period. This metric helps teams understand growth efficiency and whether customer acquisition strategies are sustainable.
For example, if a company spends $50,000 on marketing in a month and gains 500 new customers, the CAC is $100 per customer. Product teams need CAC to evaluate channel effectiveness, justify marketing budgets, and ensure the business model works. A high CAC isn't necessarily bad if customer lifetime value is significantly higher, but a CAC that exceeds lifetime value signals an unsustainable business. Teams track CAC across different channels to identify the most cost-effective acquisition sources.
For instance, organic search might have a CAC of $30 while paid ads cost $150 per customer. Understanding CAC helps product managers make informed decisions about where to invest growth resources and whether pricing needs adjustment to support sustainable scaling.[1]
Pro Tip! Compare CAC across channels monthly to spot which sources deliver the best ROI and shift budget accordingly.
Churn rate
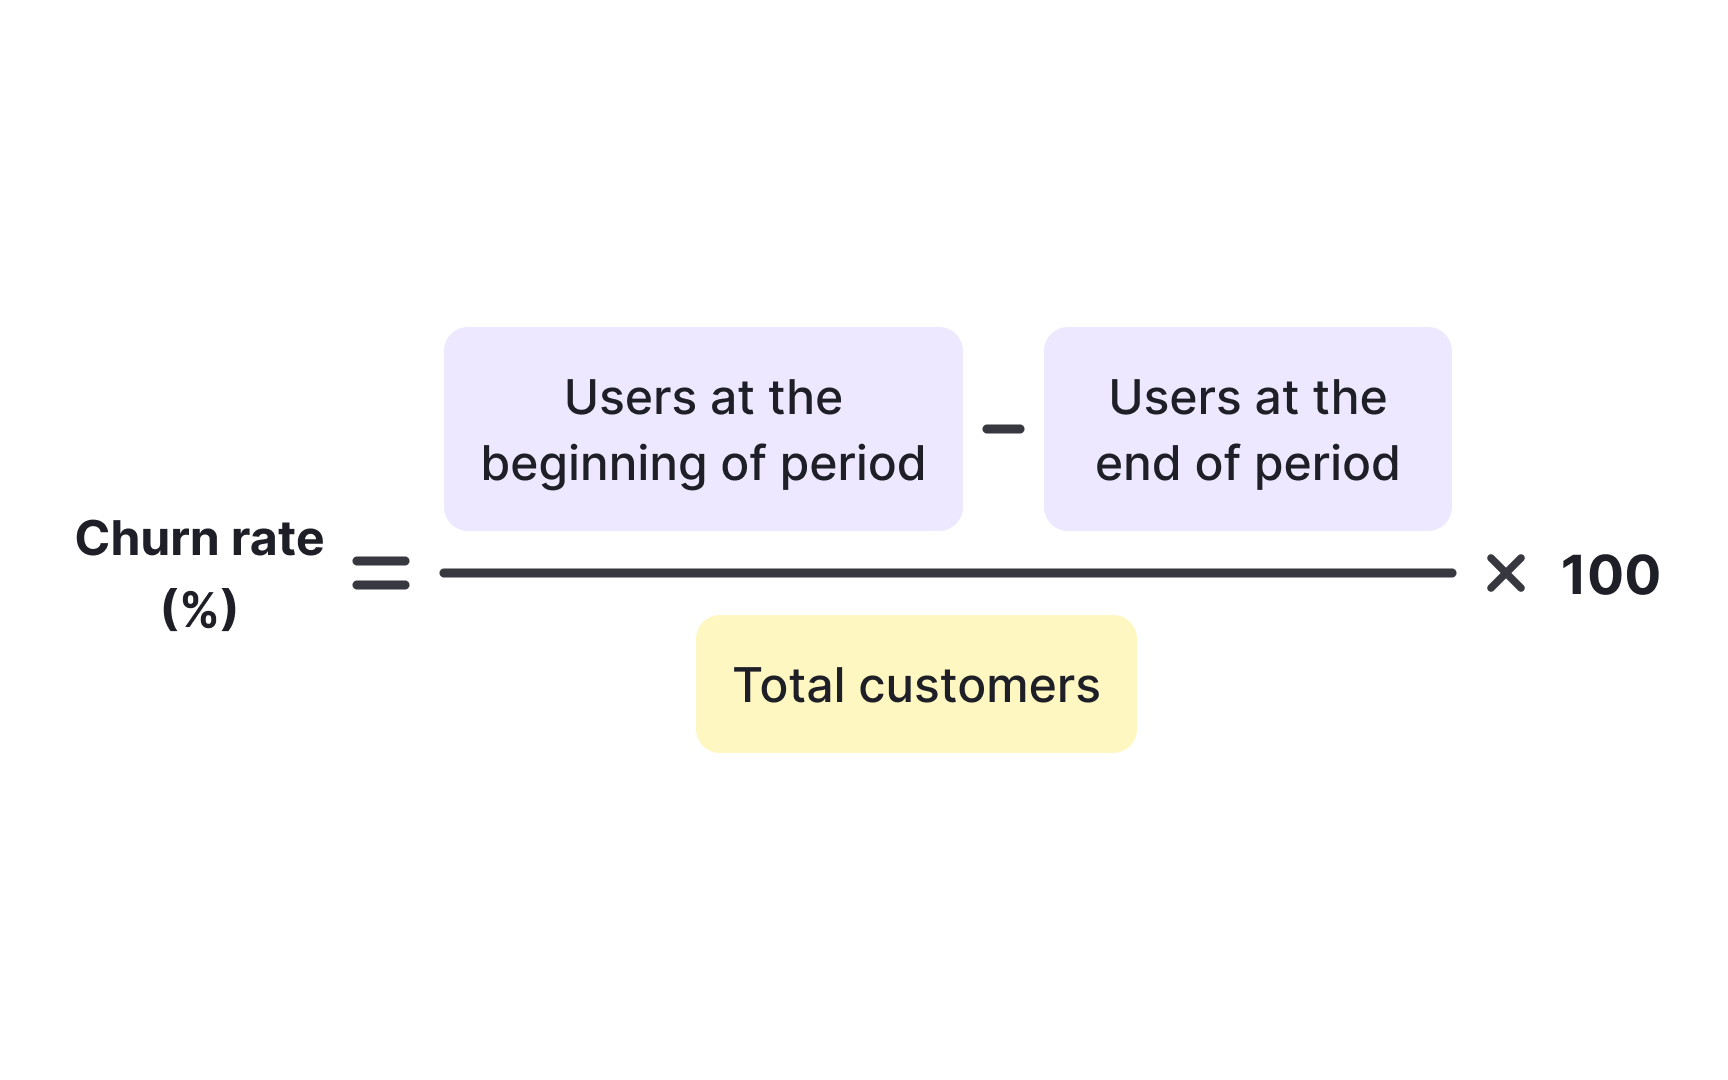
Churn refers to the rate at which customers stop using a product or cancel their subscriptions over a specific period. It's the opposite of retention and one of the most critical metrics for subscription businesses and products with recurring usage. High churn indicates that users aren't finding enough value to continue using the product, signaling problems with product-market fit, user experience, or customer expectations.
For example, if a SaaS product has 1,000 customers at the start of the month and 50 cancel by month's end, that's 5% monthly churn. Product teams monitor churn to identify at-risk customer segments, understand why users leave, and measure the impact of retention initiatives. Churn patterns often reveal product weaknesses that teams might otherwise miss.
Users who churn after the first month might indicate poor onboarding, while churn after six months could signal feature gaps or competitor advantages. Reducing churn is often more cost-effective than acquiring new customers since keeping existing customers requires less investment than finding new ones. Understanding churn helps teams prioritize improvements that keep users engaged and satisfied over time.[2]
Pro Tip! Track when users churn (day 1, week 1, month 3) to identify exactly where your product loses people.
Retention rate
Retention describes the ability of a product to keep users engaged and returning over time. It's a fundamental indicator of product value because users only continue using products that solve real problems or provide meaningful benefits. Strong retention signals product-market fit, while weak retention suggests users aren't finding enough value to justify continued use.
Product teams focus on retention because keeping existing users is typically more profitable than constantly acquiring new ones to replace those who leave. For example, a mobile app with strong retention might see 60% of users still active after 30 days, while weak retention might show only 10% remaining.
Retention strategies vary by product type but often involve improving onboarding, adding valuable features, creating habit-forming experiences, and maintaining product quality. Teams measure retention across different time periods (day 1, day 7, day 30) to understand when users drop off and why. High retention enables sustainable growth because the user base accumulates over time rather than churning away.
Product managers use retention data to prioritize features, identify successful user behaviors, and create interventions that keep users engaged with the product long-term.[3]
Pro Tip! Analyze which features retained users engage with most to double down on what actually keeps people coming back.
Product-market fit
Product-market fit describes the stage where a product successfully satisfies strong market demand, creating a sustainable match between what the product offers and what customers genuinely need. It's the point where customers actively seek the product, use it regularly, and recommend it enthusiastically to others.
Teams measure product-market fit through several indicators. One common approach asks users, "How would you feel if you could no longer use this product?" Products achieve fit when at least 40% respond "very disappointed." Strong retention rates, rapid organic growth, and high Net Promoter Scores also signal fit. For example, when Slack surveyed users, 51% said they'd be very disappointed without it, confirming the product had achieved fit.
Product-market fit isn't a one-time achievement but requires continuous validation as markets evolve. Teams that achieve fit see customers pulling the product into the market rather than the company pushing it through aggressive sales. Without product-market fit, even well-funded companies with excellent execution struggle to gain traction. Understanding whether fit exists helps teams decide whether to persevere with the current strategy or pivot to better serve market needs.[4]
Pro Tip! Survey active users quarterly with the "very disappointed" question to catch fit problems before growth stalls.
Product adoption
Product adoption measures how users begin using a product and its features, tracking the journey from awareness to regular usage. It encompasses the initial activation moment when users first experience value, as well as ongoing adoption of additional features over time. Strong adoption indicates that users understand the product's value and successfully integrate it into their workflows or lives.
For example, a project management tool might measure adoption by tracking how many teams create their first project within 24 hours of signing up. Product teams focus on adoption because early adoption success predicts long-term retention and engagement. The adoption curve typically shows an initial spike as users explore the product, followed by either sustained usage (successful adoption) or rapid drop-off (failed adoption). Feature adoption is equally important as teams track which capabilities users discover and integrate. Low feature adoption might indicate poor discoverability, unclear value, or features that don't solve real problems.
Product managers use adoption metrics to optimize onboarding flows, identify friction points, and validate whether new features resonate with users. Improving adoption often involves reducing time-to-value, clarifying benefits, and removing obstacles that prevent users from experiencing product value quickly.[5]
Pro Tip! Measure time-to-first-value (how quickly new users complete a meaningful action) to optimize onboarding.
Net Promoter Score (NPS)
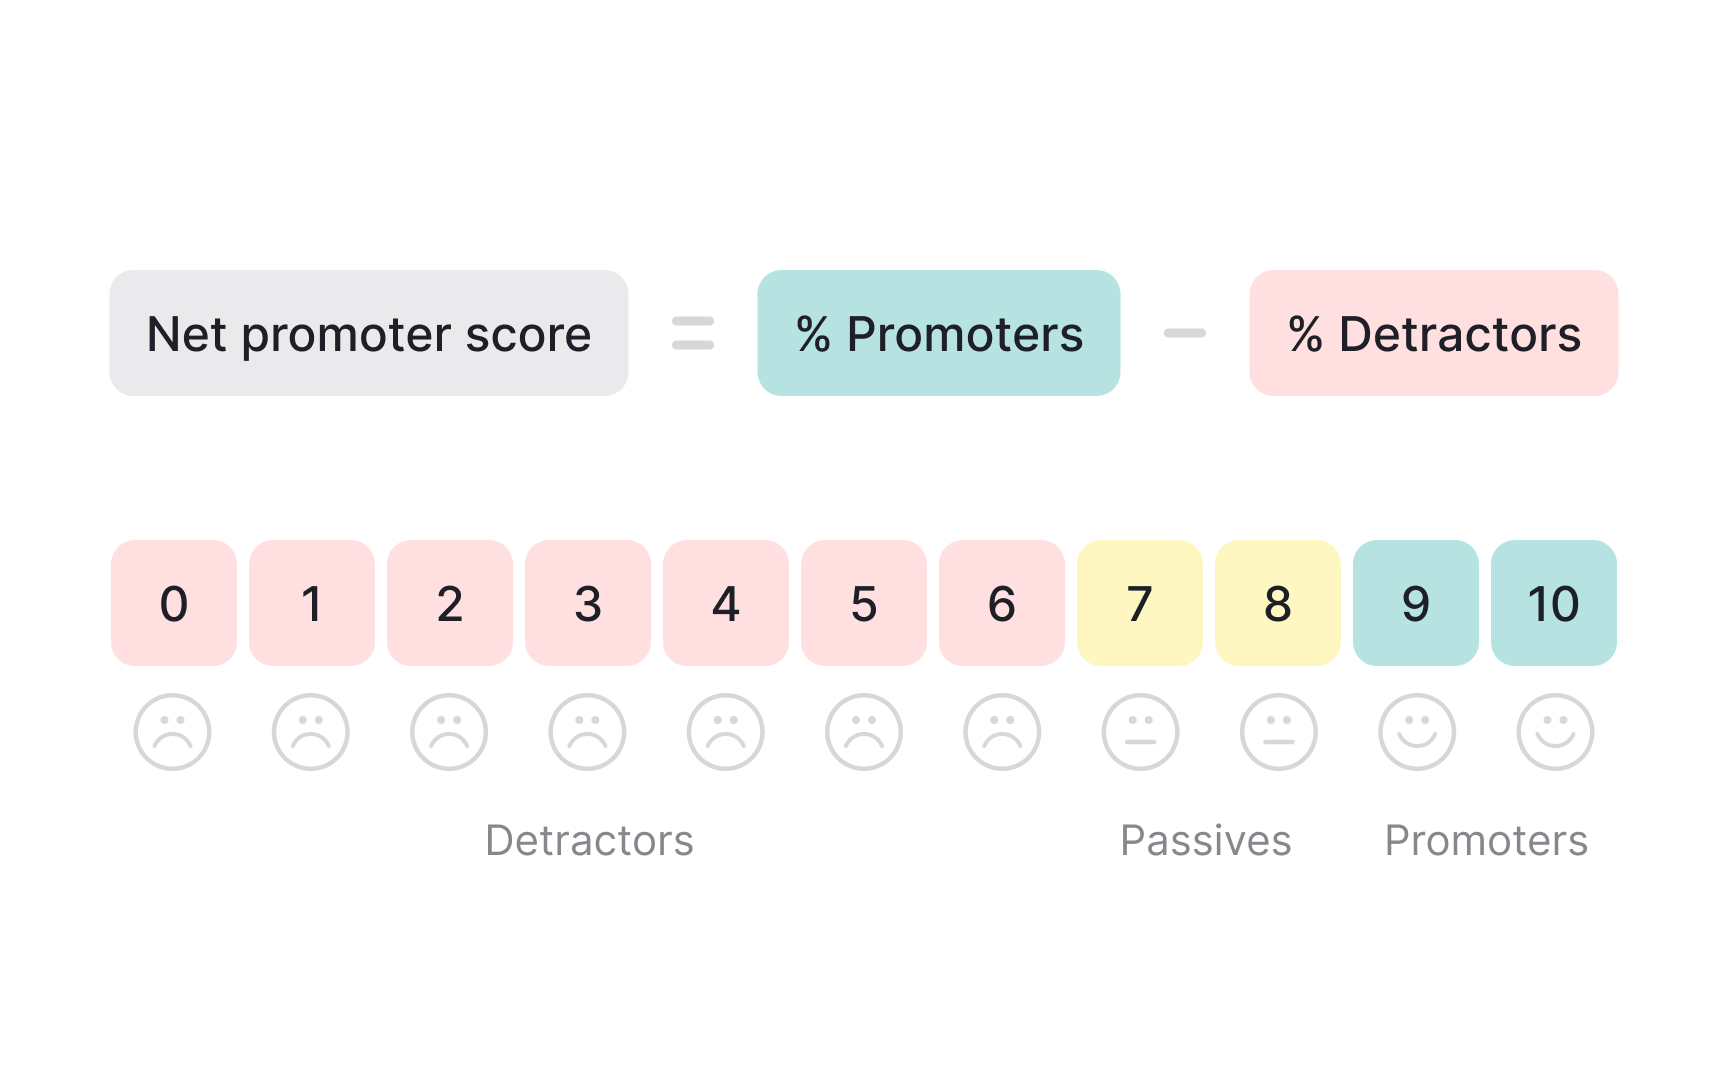
Net Promoter Score (NPS) measures customer satisfaction and loyalty by asking users how likely they are to recommend the product to others on a scale of 0 to 10. Users rating 9-10 are promoters (loyal enthusiasts), 7-8 are passives (satisfied but unenthusiastic), and 0-6 are detractors (unhappy customers who might damage the brand through negative word-of-mouth).
NPS is calculated by subtracting the percentage of detractors from the percentage of promoters, resulting in a score from negative 100 to positive 100. For example, if 60% are promoters, 30% are passives, and 10% are detractors, the NPS is 50 (60 minus 10). Product teams value NPS because it predicts business growth through organic referrals and word-of-mouth. High NPS indicates strong product-market fit and customer satisfaction, while low or negative NPS signals serious problems requiring immediate attention.
Teams often follow up the rating question with "Why did you give this score?" to gather qualitative insights about what drives satisfaction or dissatisfaction. NPS benchmarks vary by industry, but generally scores above 50 are excellent, 0-50 are good, and negative scores indicate significant issues. Tracking NPS over time helps teams measure whether product changes improve or harm customer satisfaction.
Pro Tip! Always follow up NPS ratings with "Why?" to understand what drives the score and what to fix or amplify.
Vanity metrics

Vanity metrics are measurements that look impressive on the surface but don't provide actionable insights or correlate with meaningful business outcomes. These metrics often feel good to report but fail to drive better product decisions or predict success. Common examples include total registered users (without measuring active users), page views (without engagement context), or social media followers (without conversion data).
For instance, a product might celebrate reaching 100,000 total signups while ignoring that only 5,000 users are actually active, which reveals a serious retention problem. Product teams need to distinguish vanity metrics from actionable metrics that inform specific improvements.
Vanity metrics can create false confidence, leading teams to believe they're succeeding when underlying health indicators tell a different story. The danger lies in optimizing for these misleading numbers instead of metrics that actually matter, like revenue, retention, or customer satisfaction.
A classic vanity metric trap is focusing on raw traffic without measuring whether that traffic converts or engages meaningfully. Effective product management requires discipline to ignore vanity metrics and focus on measurements that reveal product health and guide better decisions about where to invest resources for maximum impact.
Pro Tip! Before celebrating any metric, ask "If this number doubled, would our revenue or retention actually improve?”
Topics
References
- Customer Acquisition Cost (CAC) | ProductPlan
- Where modern product professionals learn UX, PM & AI skills | Uxcel
- How Product Managers Measure Product-Market Fit | ProductPlan