



.svg)

Most businesses track more than they need and understand less than they should. Data is not the problem. The problem is choosing which numbers actually reflect whether the business is working, and having the discipline to face those numbers when they are uncomfortable. Not all metrics are equal. Some measure activity and are easy to report. Others measure whether that activity created outcomes and require harder conversations. Getting clear on the difference is one of the most important shifts a growth-focused team can make. The same logic applies to leading and lagging indicators: some confirm what already happened, others warn about what is coming.
A business tracking only outcomes cannot course-correct in time. Business model shapes what you should measure. The metrics that reveal SaaS health are not the same ones that matter for e-commerce or local services. Applying the wrong framework is like using a thermometer to check tire pressure. This lesson covers how to tell useful metrics from feel-good ones, how to track conversion at every journey stage, and how to build a dashboard that drives decisions rather than reporting activity.
Vanity vs. actionable metrics




Vanity metrics go up and to the right without telling you anything useful about business health. Downloads, social followers, and website visits fall here because they measure attention, not outcomes. A product with 200,000 downloads but 3,000 active users has a retention problem that the download count will never reveal. The actionable counterpart asks the harder question: of the attention captured, how much is converted into results?
The distinction matters because vanity metrics create false confidence. A founder reporting growing Instagram followers feels productive, but if no follower ever converted to a customer, that growth contributed nothing. The pattern is consistent: vanity metrics measure activity, actionable metrics measure whether activity produced outcomes. Downloads become active users. Engagement becomes purchases. Website visits become conversions. Revenue per subscriber replaces raw subscriber count.
Awareness and engagement still matter as upstream signals. A business with no brand presence cannot build lasting customer relationships. But they belong as early indicators feeding a pipeline, not as evidence that the pipeline is working.[1]
Pro Tip! Actionable metrics are defined by the decisions they enable, not by the direction they move.
Conversion metrics at each journey stage
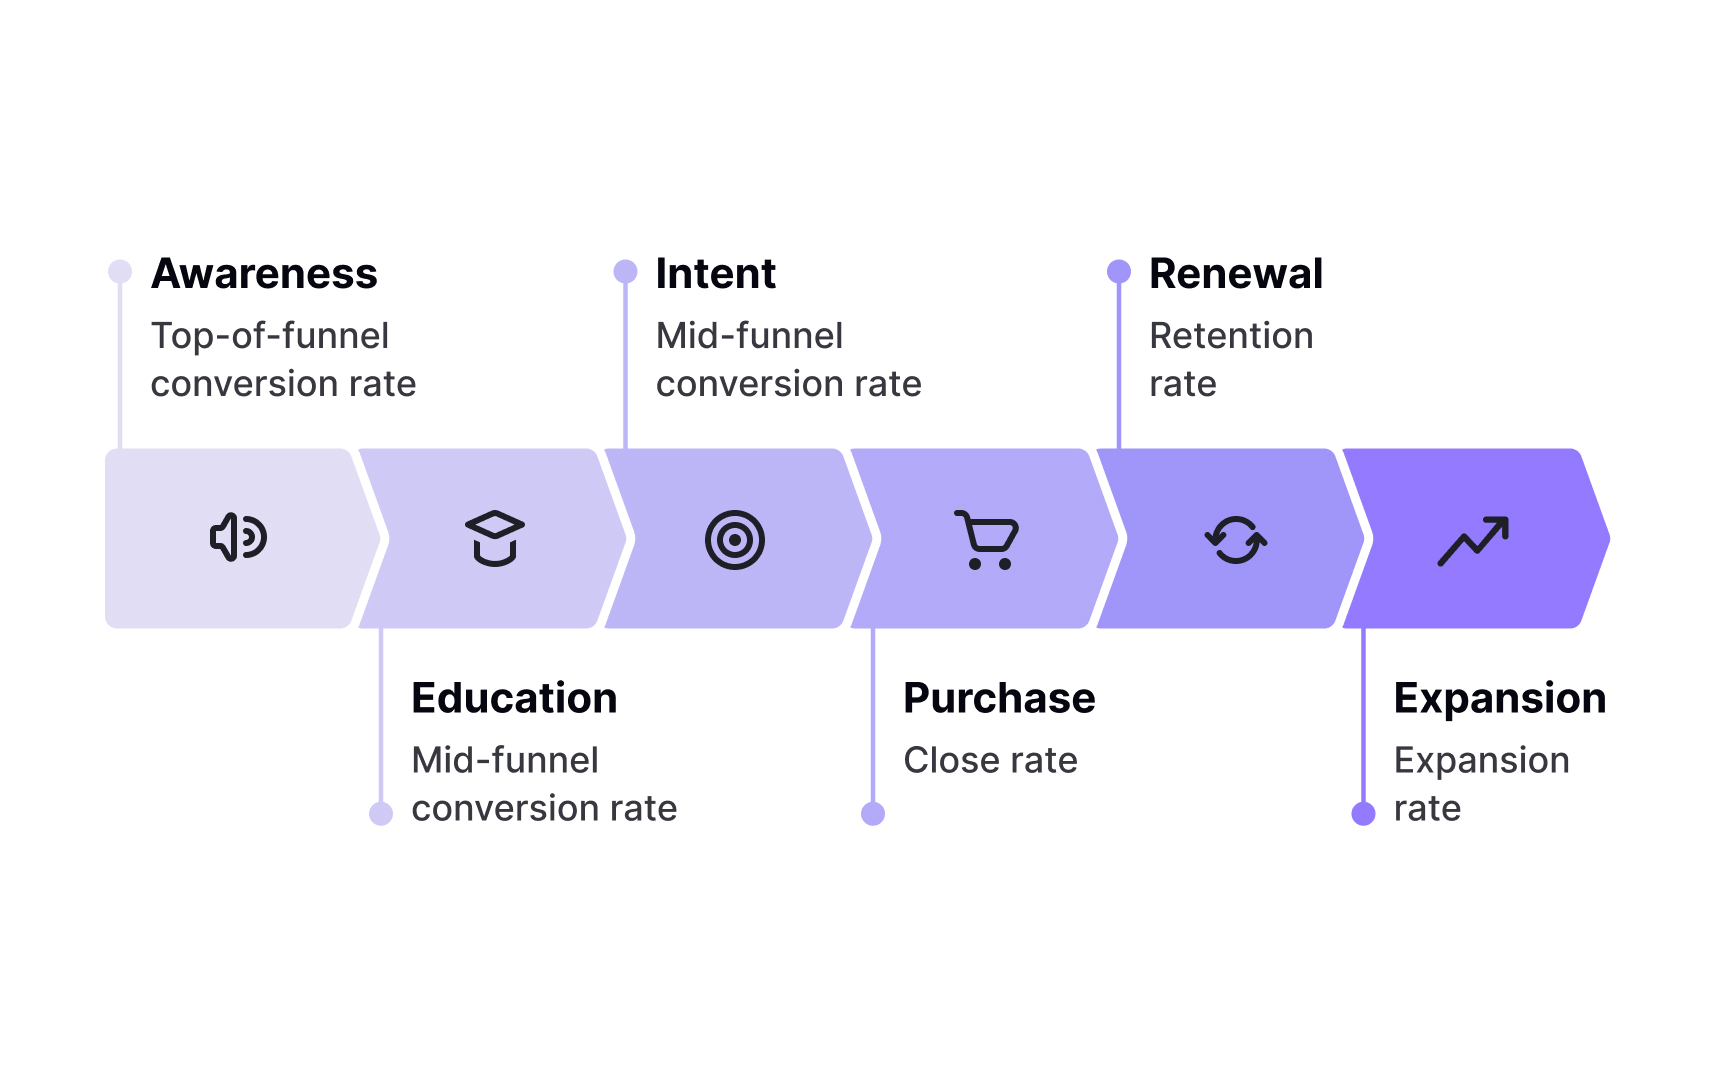
Every stage of the customer journey has a conversion metric that tells you whether that stage is functioning. Measuring only the final sale hides where the real problem lives. A company with strong top-of-funnel awareness but a broken Education-to-Intent conversion is a different situation from one with solid mid-funnel metrics but a weak close rate. Stage-by-stage measurement reveals which part of the system needs attention:
- From Awareness to Education, top-of-funnel conversion shows what proportion of aware prospects take a meaningful next step. A low number points to poor targeting, weak messaging, or excessive friction.
- From Education to Intent, mid-funnel conversion shows how many engaged prospects signal genuine purchase interest. Problems here often mean a mismatch between the audience attracted and those who actually buy.
- From Intent to Purchase, the close rate captures how many high-intent prospects become customers.
- From Purchase to Renewal, the retention rate reveals whether the product delivers its promise.
- From Renewal to Expansion, the proportion of retained customers who increase usage signals compounding value.[2]
Pro Tip! Each stage failure has a different root cause. Blending all conversions into one number hides exactly where the system breaks.
Leading vs. lagging indicators
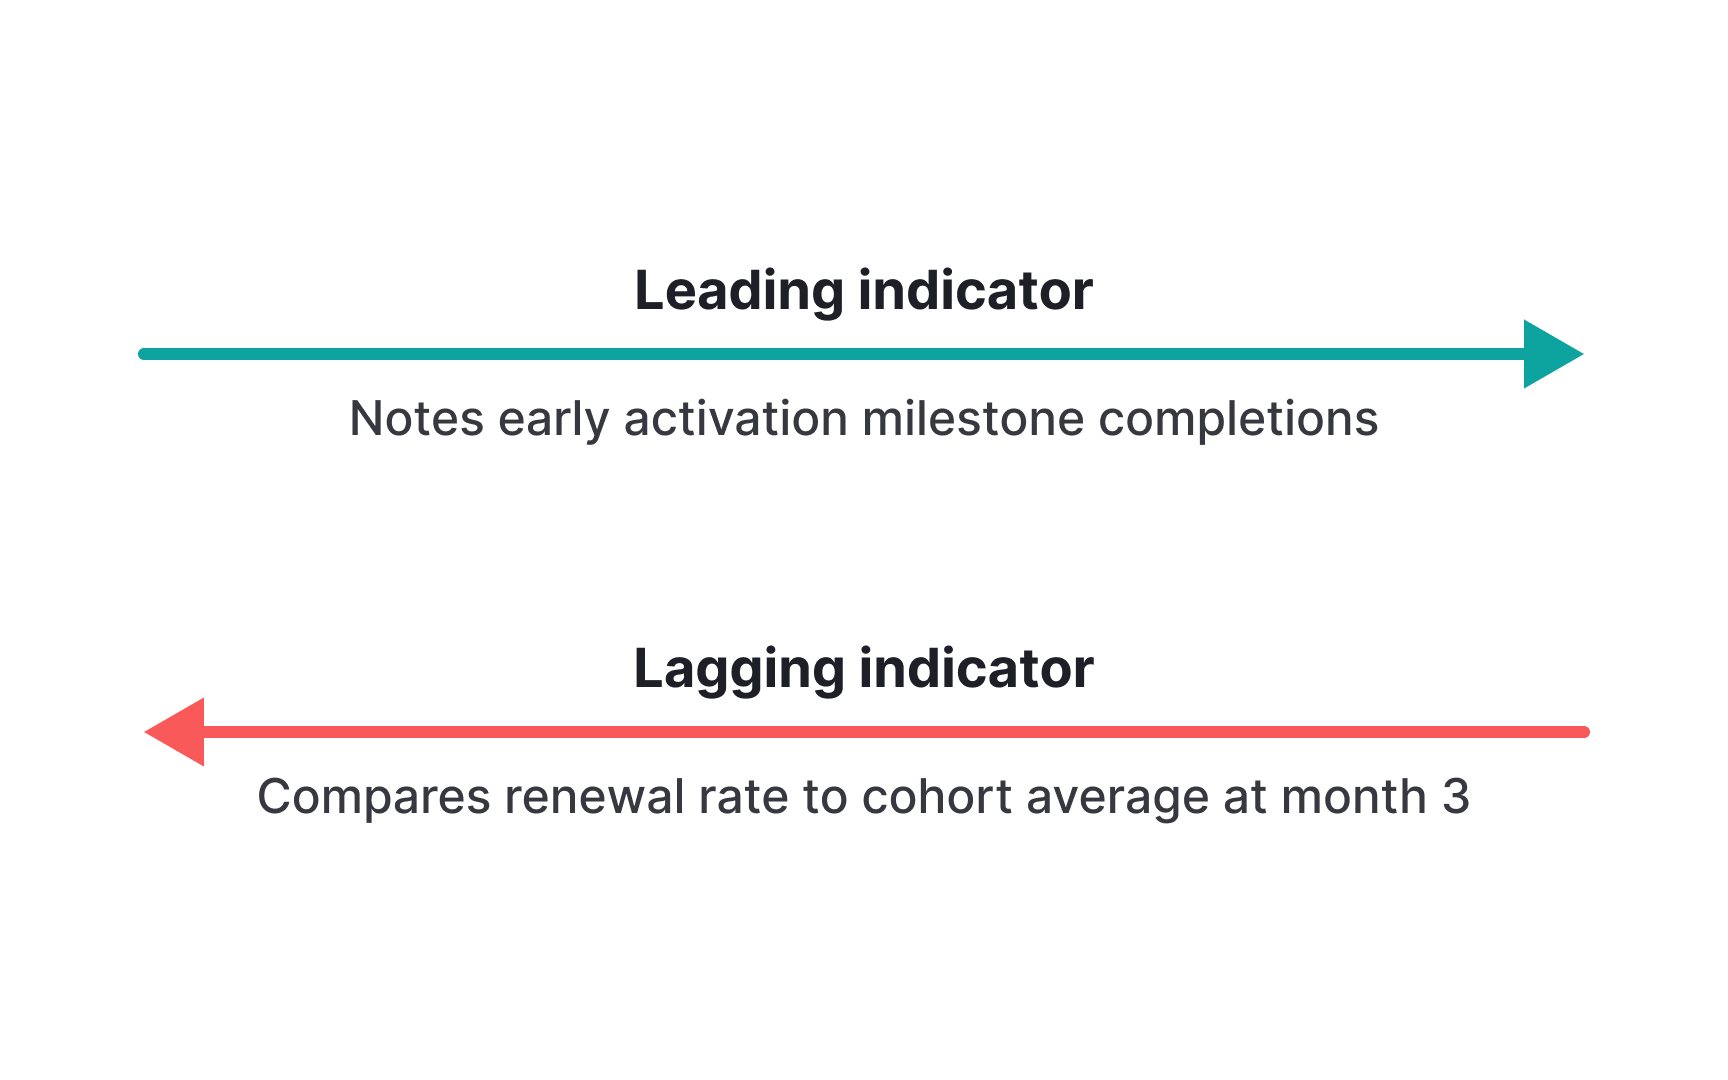
Lagging indicators confirm outcomes that have already happened: revenue, customers acquired, and churn rate. These are essential for understanding where a business stands, but they cannot help course-correct in real time. By the time a lagging metric signals a problem, that problem has been developing for weeks or months. Leading indicators predict what lagging indicators will show in the future. For a SaaS business, early product engagement in the first two weeks is a strong leading indicator of renewal rates. For an e-commerce business, repeat purchase behavior in the first 90 days predicts lifetime value. For a B2B company, the ratio of demos to proposals to closes predicts future pipeline conversion. A sales team watching only revenue reacts late. A team tracking demo volume, proposal conversion, and response rates can see problems forming before revenue falls.
A measurement system needs both types. Lagging indicators give the ground truth of where the business is. Leading indicators provide advance warning to act before that truth turns negative. Relying only on lagging metrics means steering using wake, not the water ahead.[3]
Pro Tip! If early product engagement predicts renewal, improving that engagement is a concrete action. Watching churn alone gives you the result, not the lever.
Key metrics by business model
Different business models generate value through different mechanisms, so the metrics that reveal whether they are working also differ. Applying SaaS metrics to an e-commerce business produces misleading conclusions:
- For a SaaS business, monthly recurring revenue, churn rate, and expansion revenue form the core set. MRR tells you the current state. Churn tells you whether that state is stable or eroding. Expansion reveals whether existing customers are a source of organic growth.
- For an e-commerce business, conversion rate, average order value, and repeat purchase rate are the foundation. A business where customers buy once at a high acquisition cost is almost always uneconomical.
- For a local services business, booking rate, utilization, and customer lifetime value capture health. High booking demand with low utilization signals capacity constraints. High utilization with low lifetime value means the relationship ends too quickly.
Matching metrics to the business model is a prerequisite for rational decisions. A growth marketer at a subscription business who optimizes only for new signups without watching churn is filling a bucket with a hole in it.[4]
Pro Tip! In a healthy SaaS business, expansion from existing customers eventually outpaces the cost of acquiring new ones. That ratio is a maturity signal.
Spot misleading metrics in a business update
A company can report growing numbers and still be heading toward failure if those numbers do not connect to the mechanisms that create sustainable value. Metrics that sound impressive in isolation often tell a different story when paired with the outcomes they should be influencing.
A company that grew website traffic from 30,000 to 80,000 monthly visitors looks like it has traction. If sales conversions held at 8 during the same period, the traffic increase produced no business outcome. Similarly, an app with 500,000 downloads that cannot report day-7 retention does not know whether it has customers or experiments. Social engagement without customer inquiries, subscribers who never purchase, and press coverage producing no trials are all examples of activity metrics that fail to connect to revenue outcomes.
Spotting misleading metrics requires applying a consistent follow-up question: what decision does this number enable? If the answer is "we feel good about it," it is probably vanity. If the answer is "it tells us whether to invest more or change our approach," it is probably actionable. That test applies across business types, stages, and functions.[5]
Pro Tip! Traffic without conversion data is a vanity metric. The question is never how many arrived, but how many moved forward.
Build a metrics dashboard for a specific business model
A metrics dashboard is not a collection of everything measurable. It is a deliberate set of numbers reviewed at the right frequency. More metrics rarely produce better decisions, and a dashboard requiring 40 minutes of daily review is one that gets skipped.
- For a SaaS business, a practical primary dashboard includes MRR, net new MRR, churn rate, trial-to-paid conversion, and product engagement for new users. MRR and churn are reviewed monthly. Trial conversion and engagement are reviewed weekly because they are leading indicators of what MRR will look like in 60 to 90 days.
- For an e-commerce business, the dashboard covers conversion rate, average order value, 90-day repeat purchase rate, and CAC by channel.
- For a local services business, daily booking volume, weekly utilization, and monthly customer lifetime value cover the essential picture.
Review cadence matters as much as metric selection. Leading indicators change quickly and need frequent monitoring. Lagging indicators move slowly and need only a monthly review. Mixing cadences without distinguishing them trains teams to overreact to noise or under-respond to real signals.
Pro Tip! A dashboard that mixes daily and monthly metrics without labeling them teaches teams to either panic at noise or miss real trends entirely.
Diagnose conversion problems by the funnel stage
A conversion rate problem at one funnel stage of the customer journey funnel rarely looks like one from the outside. It usually looks like a channel underperforming, a product not resonating, or a sales team missing targets. Diagnosing correctly requires isolating which stage is converting below potential and understanding why failure happens there:
- Low top-of-funnel conversion, measured as the proportion of aware prospects who take a first meaningful step, typically indicates poor targeting, messaging that fails to communicate relevance, or too much friction.
- Low mid-funnel conversion, where engaged prospects fail to signal genuine purchase intent, often reflects a mismatch between who engages with content and who actually has the problem.
- Low close rates usually point to process gaps, pricing mismatch, or unresolved objections during evaluation.
- Low renewal rates indicate the product failed to deliver expected value. Each diagnosis leads to a different fix.
Treating conversion as a single blended number hides exactly the distinction that would make improvement possible. A company that cannot say where in the journey it loses people cannot direct resources to the stage that needs them.
Build a measurement system for a new business
A measurement system is a set of metrics, their relationships to each other, the cadences at which each is reviewed, and the decisions each metric is designed to enable. Tracking 30 numbers without a framework does not produce better decisions than tracking 7 numbers well. To build one:
- Identify the lagging indicators that define success for the business model: MRR for SaaS, revenue per customer for e-commerce, and utilization for services.
- Work upstream to find the leading indicators that predict each one. Trial engagement predicts renewal. Early repeat purchase predicts lifetime value. Demo volume predicts closed revenue.
- Assign review cadences: leading indicators need frequent attention because they change quickly. Lagging indicators move slowly and reflect decisions already made.
- Define the ownership. Every metric needs a person responsible for monitoring it, interpreting changes, and proposing responses. A metric without an owner is decorative data.
The full system should fit on one page and answer one question per metric: what decision does this number help us make?[6]
Pro Tip! If a metric never changed anyone's behavior, it was always decorative. The test is whether someone acted on it last month.
Topics
References
- Vanity Metrics vs. Actionable Metrics - Guest Post by Eric Ries - The Blog of Author Tim Ferriss | The Blog of Author Tim Ferriss
- Conversion Funnel Metrics Examples | Leadpages | Leadpages
- Leading vs. Lagging Indicators (With Real-World Examples) | Amplitude
- Adoption vs Engagement: Key Differences & How to Improve Both | Thoughts about Product Adoption, User Onboarding and Good UX | Userpilot Blog
- What Is the Difference Between Vanity and Actionable Metrics? | Secoda
- Leading vs. Lagging Indicators: How to Identify and Map Your Metrics | Amplitude