Metrics give product specifications their backbone. Without measurable indicators, even the most detailed requirements can drift away from real impact. Metrics show whether the product is solving user problems, driving engagement, and delivering business value. Yet, tracking everything leads to noise.
Selecting metrics requires focus on what truly matters — the link between outcomes and value. The right metrics help teams understand progress toward goals, justify trade-offs, and decide when to adjust scope. They also create accountability, turning vague expectations into quantifiable results.
This lesson explains how to distinguish actionable metrics from vanity numbers, connect them to the product’s north star, and ensure each metric reflects user and business outcomes. From defining success criteria in specs to structuring measurable goals, it shows how well-chosen metrics make every product requirement purposeful and trackable.
Turning objectives into measurable results


A good product specification defines what success looks like. Translating objectives into measurable results brings clarity to both the problem and the expected outcome. Instead of describing a goal like “improve onboarding”, a measurable specification would set a concrete target such as “increase onboarding completion rate by 15% within 3 months.”
This shift makes the objective actionable. It helps every team see how their work contributes to the result and gives a clear reference for evaluation. To make objectives measurable, identify the user behavior that represents success, define how it can be tracked, and choose a realistic timeframe. A well-phrased metric bridges qualitative intent and quantitative proof. When goals are measurable, specifications become decision tools rather than wish lists, guiding teams toward accountable and testable outcomes.[1]
Differentiating metric types
Different metrics reveal different truths about a product. In product specifications, they serve as measurable checkpoints that connect user experience with business outcomes. To select the right ones, it helps to understand the main categories most teams rely on:
- Acquisition metrics show how new users find and start using the product, through indicators like sign-up rate or cost per acquisition
- Engagement metrics reflect how actively users interact with features, such as session frequency, time spent, or completed actions
- Retention metrics measure loyalty by tracking how many users return and how often
- Revenue metrics reveal financial performance through values like lifetime value (LTV), average revenue per user (ARPU), or recurring revenue
- Satisfaction metrics capture user sentiment using signals such as Net Promoter Score (NPS) or customer effort score
These categories work well for B2C products or products that directly influence sales. For B2B or platform products, they may not map as naturally. In those contexts, focus on how the product drives business goals and check what metrics the business is already measuring. Aligning with those gives the specification more relevance and makes it easier to get stakeholder buy-in.
It is also worth acknowledging that not every product or stage of development calls for a full metrics framework. Given timing or product complexity, there may be areas where defining metrics does not yet make sense. In those cases, being honest about that in the spec is better than forcing measurements that do not reflect reality.
Avoiding vanity metrics
Not all numbers reveal real progress. Vanity metrics look impressive but fail to inform meaningful decisions. They often track activity instead of impact: downloads instead of retention, page views instead of engagement, or total sign-ups without considering churn. These metrics create an illusion of success and can easily mislead teams when defining priorities in product specs.
To avoid them, focus on metrics that show a clear link between user behavior and business value. A useful metric answers a question that leads to action: “What behavior should increase or decrease if the product succeeds?” For example, tracking weekly active users is more insightful than counting total installs, because it shows consistent value delivery. During specification writing, review each proposed metric and ask whether improving it would genuinely advance the goal. If not, it belongs in a report, not in the spec.
Pro Tip! When choosing metrics, replace ‘how many?’ with “how well?’. Measure value, not volume.
Defining a north star metric
Every product needs a single guiding metric that reflects its core value. The north star captures the moment users experience real benefit and shows whether the product is moving in the right direction. A good north star metric is measurable, time-bound, influenced by multiple teams, and directly tied to the value proposition.
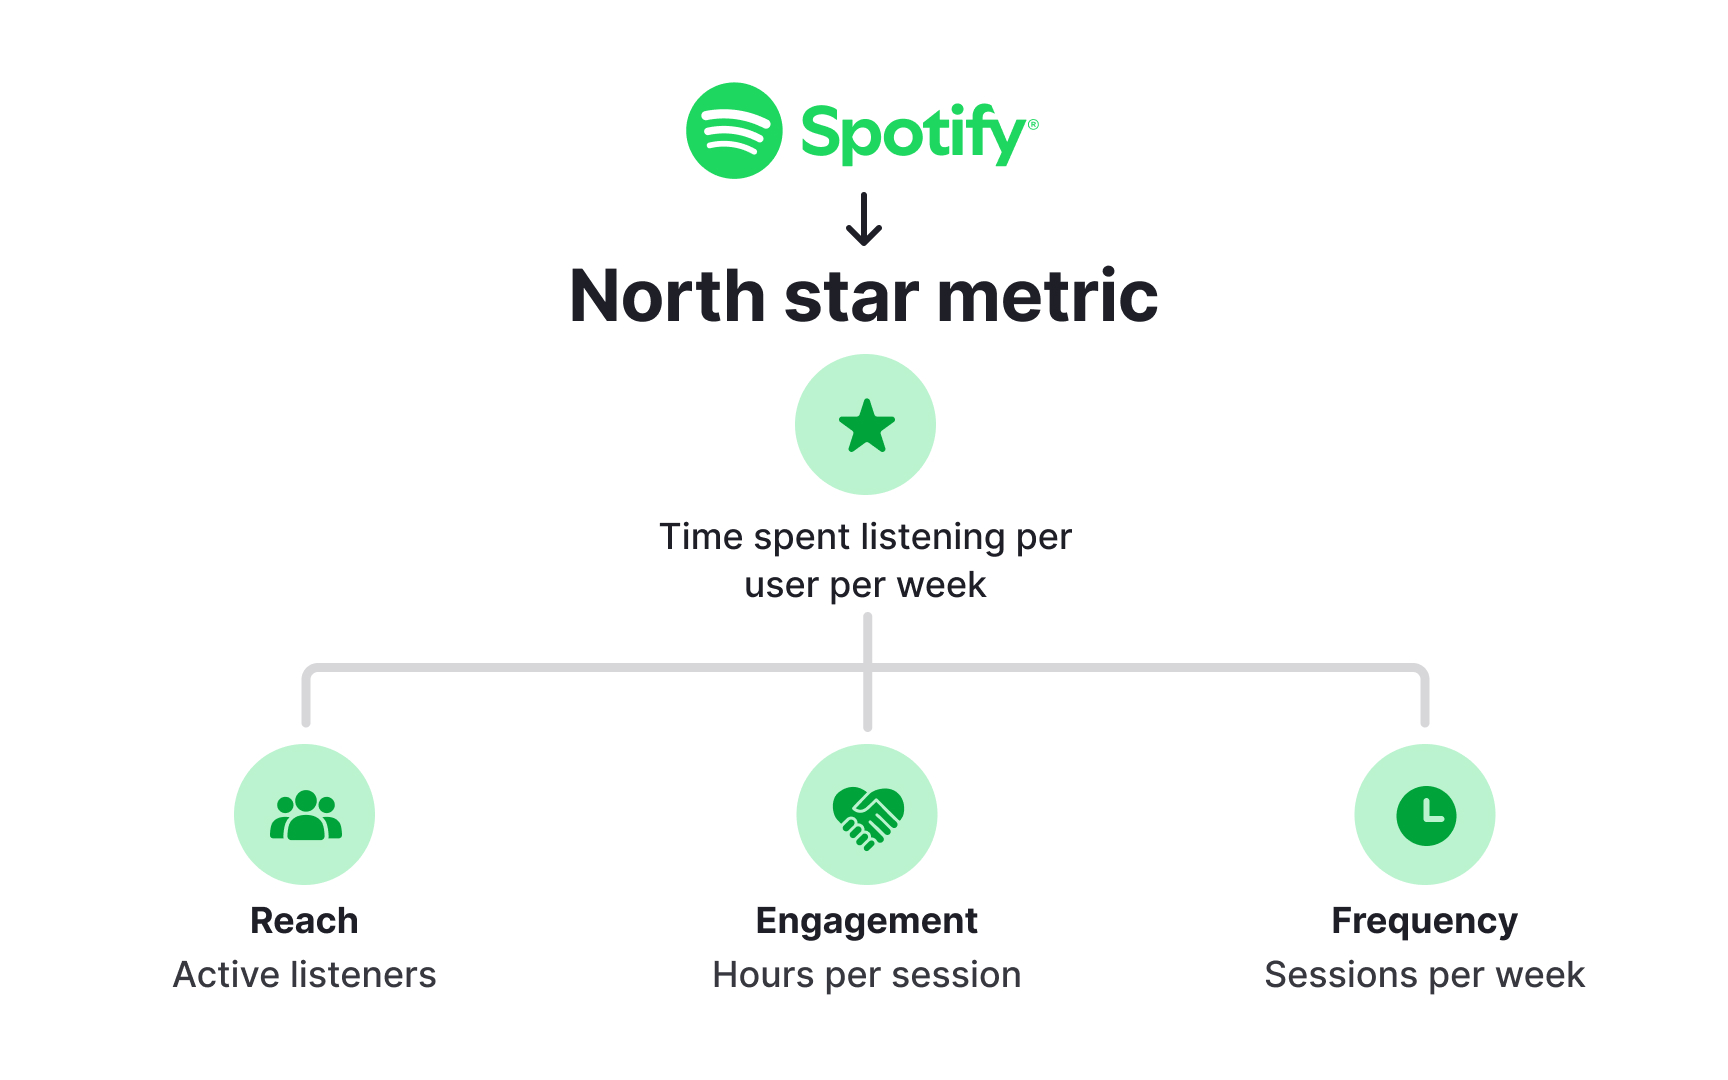
For example, Uber Eats could measure the number of successfully delivered and positively rated orders per week, not just total orders placed. This metric connects user satisfaction with company growth. Spotify might track time spent listening per user per week, which reflects both engagement and content relevance.
When writing specifications, defining or referencing the north star metric keeps priorities focused. It prevents teams from optimizing isolated tasks and ensures every feature and improvement contributes to a shared definition of success.[2]
Pro Tip! Choose one north star metric that every team can influence. It should unite product efforts rather than separate them.
Connecting the north star and supporting metrics
While the north star metric captures the product’s overall value, it cannot work in isolation. Supporting metrics make it actionable by showing what drives or slows progress toward that main goal. These usually fall into two levels:
- Primary metrics (L1) directly influence the north star and help teams understand which levers matter most. For example, if Spotify’s north star is time spent listening per user per week, an L1 metric could be hours per session because it reflects how engaged listeners are during each visit.
- Supporting metrics (L2) track earlier signals and help spot issues before they escalate. In Spotify’s case, L2 metrics might include playlist saves or session starts per week, since both hint at future engagement.
L2 metrics not only influence L1. They also affect each other in ways that are easy to overlook:
- Increasing hours per session might reduce session frequency, since longer sessions can lead to fewer of them
- Frequency and engagement can affect active listeners if sessions tend to happen during hours when users listen together
In larger organizations, these connections extend beyond a single team. A feature that makes it easier to browse multiple products might boost engagement metrics while reducing the number of users reaching checkout, creating an unintended problem for another team. Before finalizing metrics in a specification, map the potential impact on other teams and their goals.
Selecting metrics aligned with goals
Choosing the right metrics depends on the stage of the product, the company’s priorities, and the specific goal each specification addresses. Early-stage products might focus on activation and engagement, while mature products may prioritize retention and revenue. To align metrics with goals, start by asking 3 questions:
- What outcome defines success for this feature or initiative?
- Which user behavior best represents that outcome?
- How can it be measured consistently over time?
For example, an onboarding redesign might target completion rate or time to first action, while a new subscription feature could rely on conversion rate or monthly recurring revenue. Metrics should always connect back to the company’s strategic goals and help teams understand whether their work is moving the product forward.
Pro Tip! When in doubt, trace each metric back to a business goal. If the link feels weak, replace it with one that reflects real progress.
Interpreting and segmenting data
Once metrics are tracked, interpreting them correctly is just as important as selecting them. A single number rarely tells the full story. Segmenting data helps reveal hidden patterns that explain why a metric changes. For example, a drop in engagement might only affect new users, or high churn could come from one region or device type. Looking at overall averages without segmentation can lead to misleading conclusions.
When writing product specs, note which user groups or contexts matter most for measurement. Segments can be defined by demographics, platform, location, or behavior. Connecting metrics to specific user segments allows teams to prioritize accurately and design targeted improvements.
That said, segmentation surfaces questions, not answers. Never assume causation or even correlation when a metric moves. A change in a number is a starting point for inquiry, not proof that a specific release caused it. If the reason is unclear, form several hypotheses and work to prove them. When using data to find opportunities and generate ideas, do not assume the ideas will produce the expected result until they have been tested. Frameworks like A/B testing exist precisely to validate those assumptions before committing to a direction.
Choosing tools for tracking and visualization

Selecting the right analytics tools is essential for turning data into insight. Product teams rely on tracking platforms to collect usage data, visualize patterns, and monitor progress against goals defined in specifications. The best tools are those that align with the metrics you plan to track and can integrate with your existing workflow.
Platforms like Mixpanel, Amplitude, and Google Analytics specialize in tracking user flows and event data. Tools such as FullStory and Heap help visualize the user journey through session recordings and heatmaps.
Pendo and Gainsight offer strong capabilities for in-app surveys, onboarding walkthroughs, and retention analysis.
When choosing one, consider such criteria as:
- Features and integration options
- Pricing and scalability
- Ease of use for the teams who will rely on it daily
The goal is not to collect endless data but to focus on what helps teams act faster and validate assumptions. Linking analytics dashboards to metrics listed in product specs creates a direct feedback loop between planning and performance.
Once the tools and metrics are defined, also decide when you will review them. It is easy for metric reviews to slip when everyone is focused on delivery. Setting a regular cadence, whether weekly, biweekly, or after each release, ensures that performance data is actually used to inform decisions rather than sitting unexamined in a dashboard.
Aligning teams around shared metrics
Metrics become powerful only when they guide collective action. Product, design, engineering, and business teams each have their own priorities, but shared metrics align everyone on what success means. When the same indicators appear in both product specs and team dashboards, decisions become faster and less subjective.
A good alignment process starts with defining a shared north star and its supporting metrics. Each team then identifies how its work influences these numbers. For example, design might track task completion rate to support engagement, while engineering focuses on performance uptime to support satisfaction. Keeping these connected ensures that improvements in one area strengthen, not compete with, others.
Alignment does not stop at planning. After delivering a functionality or product change, share how it impacted the metrics with the broader team. This closes the loop between what was planned and what actually happened, builds a culture of accountability, and gives everyone the context needed to make better decisions on the next iteration. When metrics drive collaboration this way, they turn specs into living agreements rather than static documents.
Pro Tip! Use the same metric names and definitions across all teams. Shared language builds shared accountability.