


.svg)

Customer acquisition cost has a simple formula and a systematic way of being calculated incorrectly. The number most early-stage companies report is not their actual CAC. It is an optimistic version that excludes salary costs, overhead allocations, and time-period mismatches that inflate the true investment required to acquire a new customer. Understanding CAC correctly matters because it makes every other growth decision rational. Without an accurate CAC, headcount targets, channel investments, and revenue forecasts rest on assumptions that may not reflect reality. With one, the question of whether a growth plan is funded shifts from a gut feeling to a calculation.
This lesson covers the full CAC formula and every cost category that belongs in it, including the ones most often omitted. It covers how period alignment changes the result in businesses with long sales cycles, why the same product produces a different CAC across channels and customer segments, and what the 3 most common errors are that make CAC look healthier than it is. It finishes with how CAC connects to planning and which approaches to reducing it produce real improvements.
What CAC is and why it matters
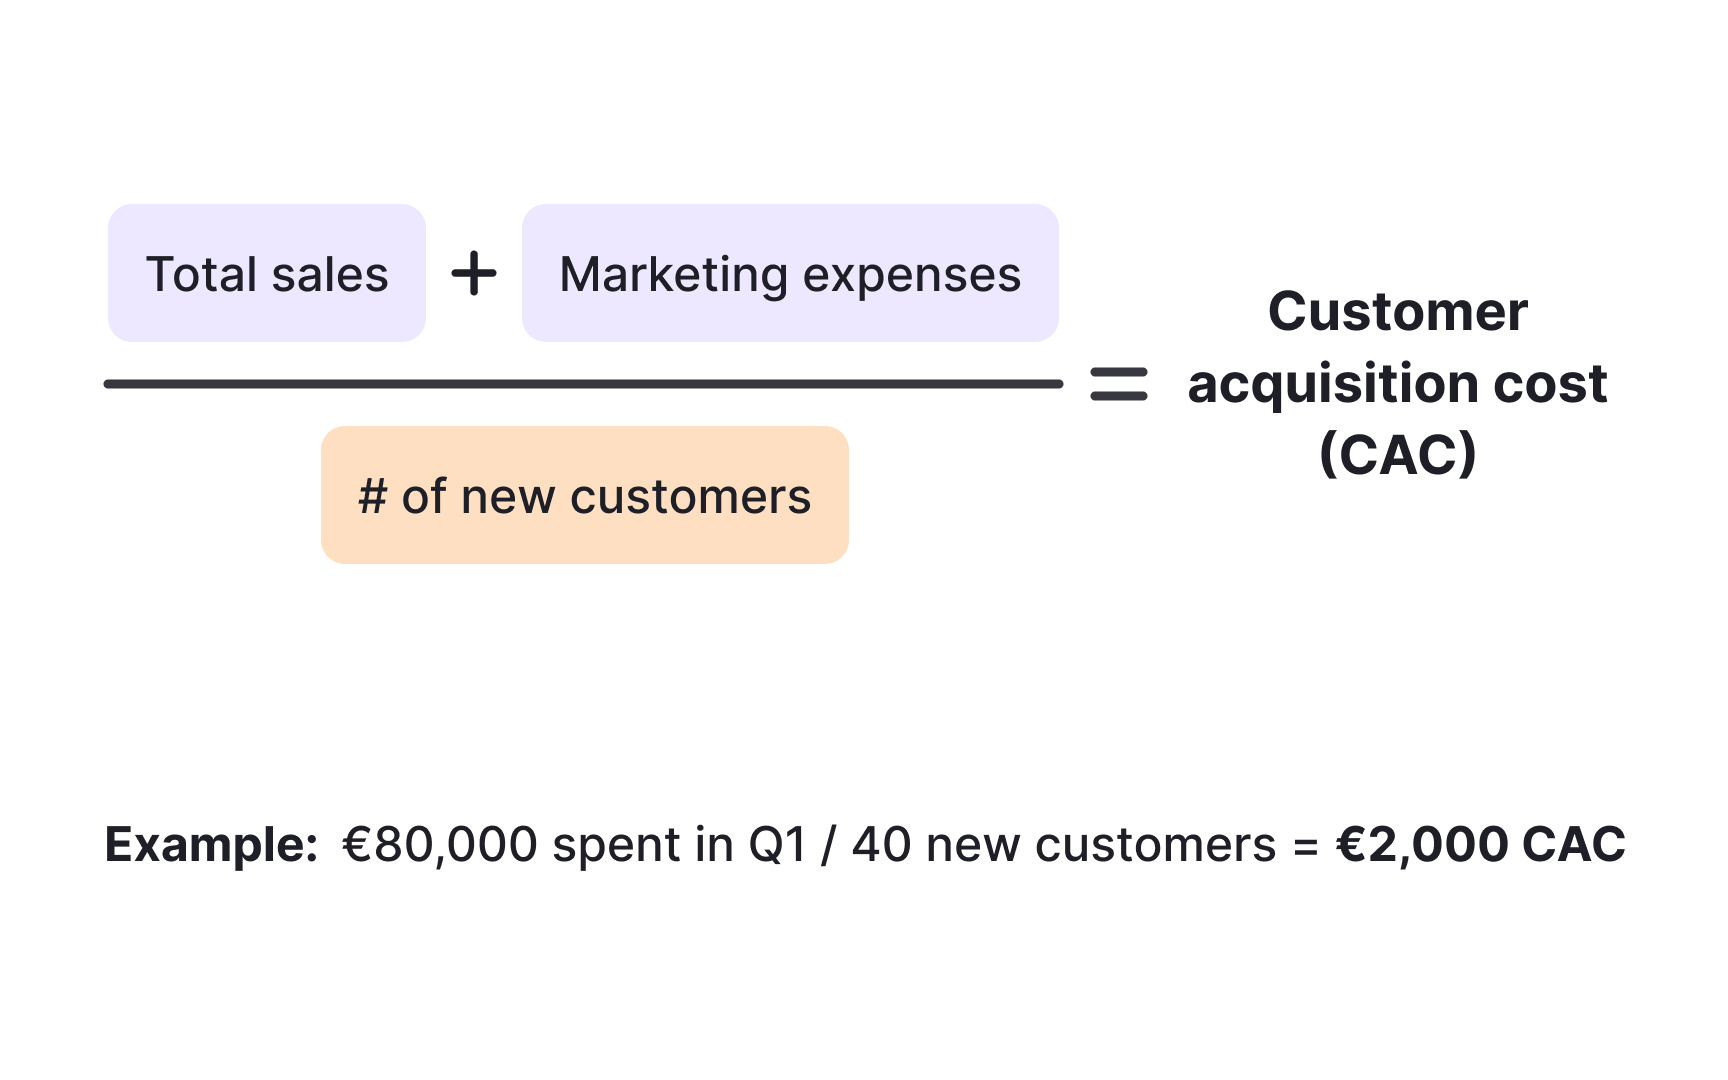
Customer acquisition cost (CAC) is the total amount a business spends to acquire one new paying customer. The formula is straightforward: divide all sales and marketing expenses for a given period by the number of new customers acquired in that same period. If a company spent €80,000 on sales and marketing in Q1 and acquired 40 new customers, the Q1 CAC is €2,000. What makes CAC powerful is not the number itself but what you do with it. CAC tells you what growth costs. If the goal is 100 new customers and the current CAC is €2,000, that requires €200,000 in sales and marketing investment. If the current budget is €100,000, either the budget increases or the CAC decreases before the growth target becomes achievable. CAC also quantifies the efficiency of acquisition: a falling CAC over time means the business is getting better at converting investment into customers. A rising CAC is an early warning that something has changed, whether competition has increased, the best audiences have been exhausted, or conversion is deteriorating somewhere in the funnel. Without knowing CAC, decisions about channels, teams, and growth targets rest on guesswork rather than evidence.[1]
All cost components that belong in CAC
CAC is routinely underestimated because founders include the visible costs and overlook the rest. The formula requires total sales and marketing expenses, which is a broader category than most initial calculations capture:
- Sales expenses include the salaries and commissions of everyone involved in closing new customers: sales representatives, sales development representatives, sales managers, and operations staff. They include tools the team uses: CRM software, calling platforms, sales intelligence subscriptions, and proposal tools, plus travel and conference attendance.
- Marketing expenses include marketing team salaries, paid advertising across all channels, automation platforms, analytics tools, design software, agency fees, and event costs.
Recognizing all cost categories is what separates a CAC calculation that informs decisions from one that just confirms existing assumptions.[2]
Pro Tip! The rule of thumb: if the expense exists to support winning new customers, it belongs in CAC. Salaries almost always pass that test.
Period alignment in CAC calculations
Getting the time period right in a CAC calculation matters as much as getting the cost components right. The formula requires that the numerator and denominator reflect the same period, and that the period accounts for the actual length of the sales cycle.
If a company spent €150,000 on sales and marketing from January through June and acquired 30 customers who signed in those same months, the blended CAC is €5,000. The mistake is mixing periods: using full-year expenses but only counting customers who signed in Q4, or attributing a customer who closed after a 6-month sales cycle entirely to the month of signature rather than the full investment period that produced them. Enterprise deals with 6-18 month sales cycles are especially vulnerable to this distortion. The marketing investment generating a January lead may not show in revenue until July, and a CAC calculation that ignores this lag produces numbers that appear too low in periods of heavy investment and too high afterward. Consistent period alignment ensures the CAC number reflects genuine acquisition economics rather than an artifact of how the calendar was divided..[1]
CAC varies by acquisition channel
The same product sold through different channels produces very different customer acquisition costs. A blended CAC across all channels shows the average but hides which channels are building the business and which are consuming resources without proportionate return:
- A direct enterprise sales team might produce customers at a CAC of €8,000-€15,000. Those customers often carry large contracts, so the economics can still work.
- Self-serve online acquisition might generate customers at €300-€800 CAC, but at smaller contract sizes.
- Content marketing and SEO often produce the lowest long-run CAC because published content continues generating customers after the initial investment is made. The challenge is a 6-18 month lag between content investment and its customer acquisition contribution, making the economics difficult to see clearly in short windows.
- Paid advertising produces more immediate CAC, but efficiency degrades as spend scales because efficient audience segments get exhausted.
Calculating CAC separately by channel allows investment to flow toward the channels that actually deliver, and away from the ones that do not.[3]
CAC varies by customer segment
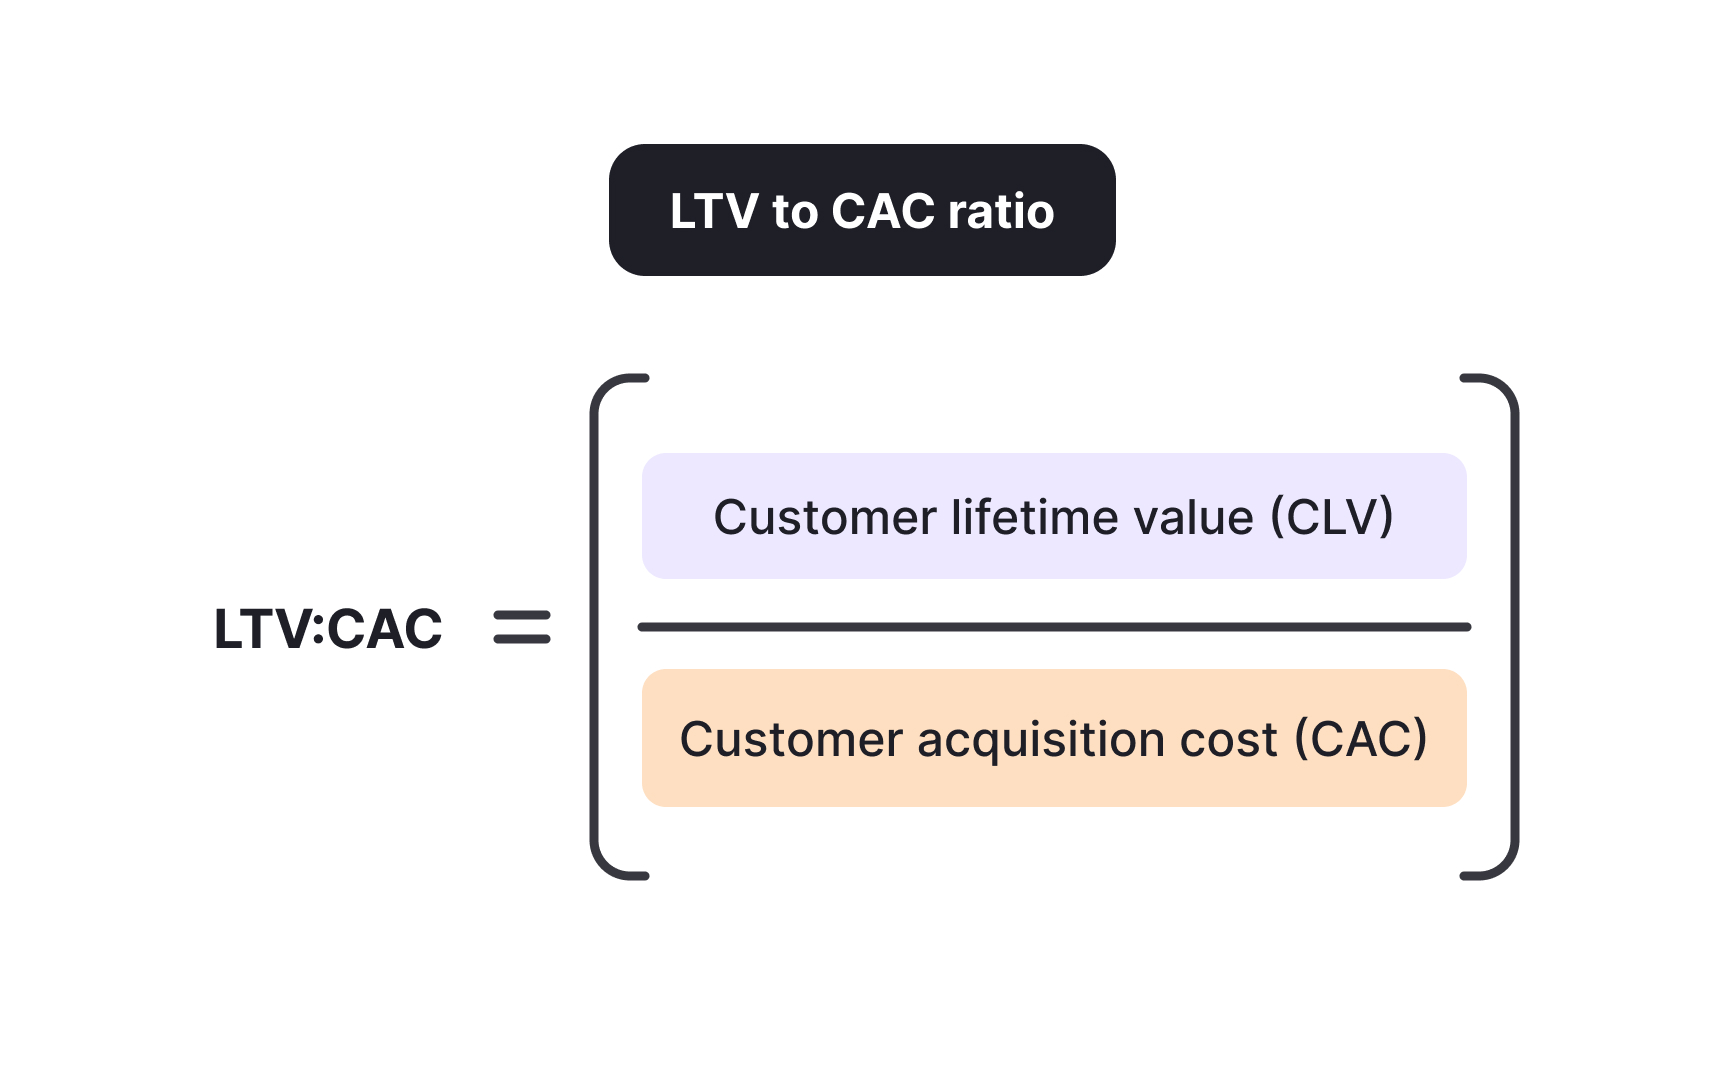
Customer acquisition costs vary by customer segment, and the segment with the lower CAC is not automatically the better investment. The relevant question is always which segment produces the best ratio of CAC to lifetime value. The ratio matters because CAC in isolation only tells you what you spent. Lifetime value tells you what you got back. Only the relationship between the two reveals whether acquiring that customer was worth it at all.
Enterprise customers take longer to acquire and involve more senior sales resources, which raises their CAC. But enterprise customers also generate more revenue, stay longer, and expand their usage over time. A €12,000 CAC for a customer generating €90,000 in lifetime value produces a ratio of 1:7.5.
Small and medium business (SMB) customers are typically cheaper to acquire through self-serve or lighter sales motions, but they often churn at higher rates and expand less. An €800 CAC for a customer generating €1,600 in lifetime value produces a ratio of 1:2, which is below the sustainable threshold. The CAC in isolation makes the SMB channel look attractive. The ratio tells a different story.
A blended CAC that mixes enterprise and SMB economics can look acceptable overall while one segment subsidizes another. Breaking the analysis apart by segment shows which deserves more investment and which needs a different approach.[4]
Common CAC calculation errors
3 calculation errors account for most CAC underestimation in early-stage businesses, and each produces a number that looks healthier than reality warrants:
- Forgetting salaries: founders frequently calculate CAC by adding advertising spend and tool subscriptions while excluding compensation entirely. If a company has a 2-person sales team at €180,000 in total annual compensation and those reps close 45 customers per year, salary alone adds €4,000 per customer before any other costs are counted.
- Wrong time period alignment: using different windows for expenses and customer counts, such as averaging full-year sales costs against customers acquired in Q4 only.
- Ignoring overhead. The office the sales team uses, the IT infrastructure supporting their tools, and the HR function managing their employment all exist in part to support acquisition. Excluding these systematically understates the true cost.
Each error individually produces a flattering CAC. Combined, they can make a broken acquisition model look viable. The true CAC after correcting all 3 is often 2-3 times the originally reported figure.[5]
Use CAC to plan and forecast growth


CAC is not interesting as a standalone number. Its value comes from what it enables you to plan. Once you know what it costs to acquire one customer, growth targets become resource requirements rather than aspirations.
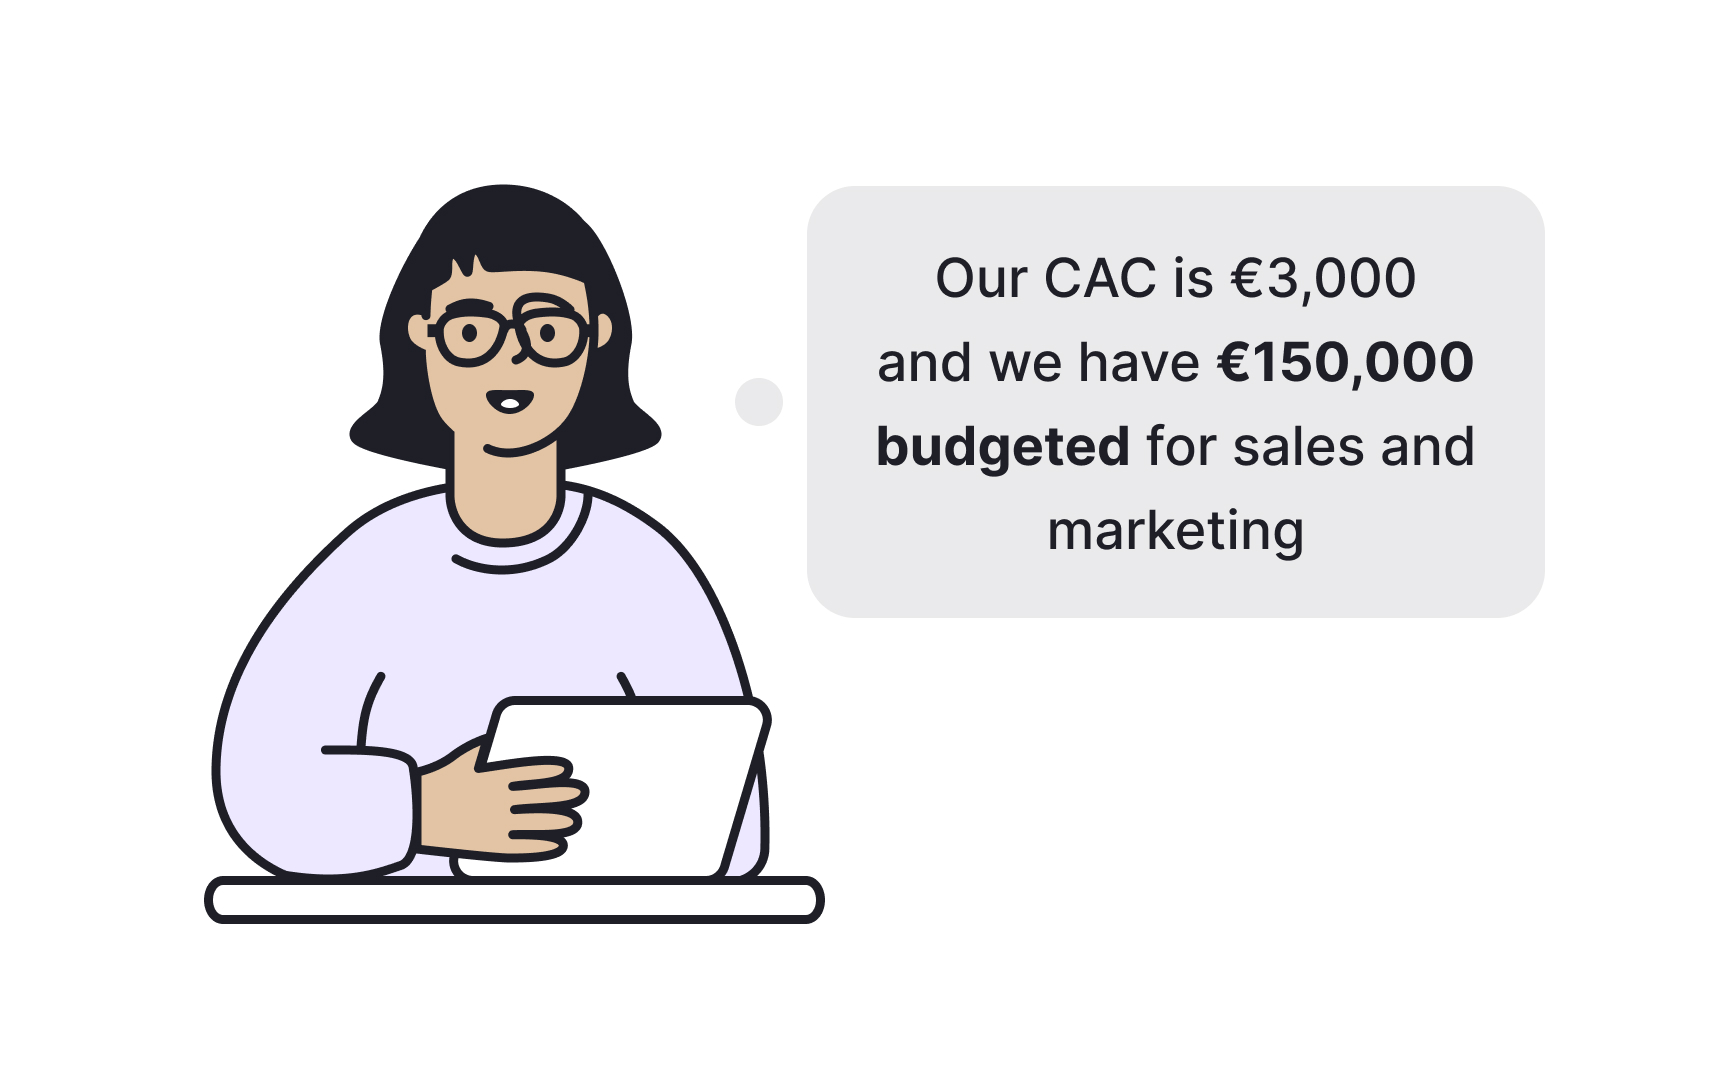
A company with a €3,000 CAC targeting 50 new customers in the next 12 months needs €150,000 in sales and marketing investment to reach that goal, assuming CAC holds. If the available budget is €90,000, the company can either reduce the target, work to bring CAC down, or find additional budget. None of those decisions is possible without knowing the starting CAC.
CAC also evolves in predictable ways over time. Paid channels tend to become less efficient at scale because the most accessible audiences are reached first. Content and organic channels start expensive in effort but become more efficient as compounding takes effect. A channel strategy built on tracking CAC over time, not just at one moment, reveals these dynamics early enough to act on them.
Understanding CAC as a planning input rather than a reporting output separates acquisition strategies that scale from those that deteriorate under pressure.[6]
Pro Tip! "We want to grow 3x" is an aspiration. "We want to grow 3x, which requires €900,000 in acquisition investment at our current CAC" is a plan.
Reduce CAC through structural improvements
Reducing CAC means either spending less to acquire each customer or converting a higher proportion of the investment already being made. The most durable reductions come from structural improvements, not from cutting activities that drive growth:
- Improving conversion rates at each funnel stage reduces CAC without reducing reach. If a company converts 2% of paid traffic to trials and 15% of trials to paying customers, improving trial-to-paid conversion from 15% to 20% reduces CAC by 25% with no change in ad spend.
- Referral programs produce customers at near-zero marginal CAC because existing customers bear the acquisition cost. Products with clear referral incentives generate compounding organic acquisition.
- Content marketing reduces CAC over time because each published asset continues to generate inbound customers long after the creation cost is paid. The lag is real: content-driven improvements take 6-18 months to materialize, but the long-run economics are often better than any paid channel at scale.
The channels with the lowest long-run CAC are usually worth the most investment, even when they require patience before the economics become visible.[7]
Topics
References
- How To (Actually) Calculate CAC at andrewchen
- CAC by Channel – 2026 Benchmarks – First Page Sage | First Page Sage
- Average customer acquisition cost by industry: 2026 benchmarks
- Customer Acquisition Cost (CAC): What It Is & Why It Matters | Neil Patel
- Customer Acquisition Cost (CAC) | Corporate Finance Institute
- Customer acquisition cost (CAC): Calculate and reduce it