Research that is not organized is research that gets lost. Teams often invest significant effort in data collection and analysis, then find that findings are scattered across notes, recordings, and individual researchers' memories. Without a system, insights do not compound. Each project starts from scratch, and the same problems get rediscovered rather than built on.
Organizing research well involves decisions at every stage. Before collecting data, teams benefit from consistent formats for notes, file naming conventions, and a shared structure for storing recordings and transcripts. During analysis, methods like coding and affinity mapping help surface patterns across sessions. After a study, a research repository makes findings searchable and reusable, turning individual studies into institutional knowledge.
The right system depends on who needs access to research findings, how often, and for what purposes. A small team running occasional studies has different needs than a research practice supporting multiple product lines. This lesson covers the core techniques for keeping research organized in ways that make the work genuinely useful beyond the immediate project.
Benefits of organizing research findings
Raw research data doesn't speak for itself. Before insights can drive decisions, someone has to make sense of what was collected, group it logically, and store it somewhere the whole team can find it again. That's what organizing your research findings is really about.
When your findings are well-organized, you give the team something concrete to work with. Disagreements between stakeholders get resolved faster because there's a shared source of truth to reference. Sharing insights with other teams or presenting them to leadership becomes straightforward rather than a scramble to remember what was found and where it lives.
The long-term value is just as real. Research is expensive and time-consuming, so findings that can be revisited and reused stretch that investment further. A study on onboarding friction from last quarter might be exactly what your team needs when planning a redesign six months later.
Pro Tip! Think of your organized findings as a research library, not just a project archive. The easier it is for a teammate to search and explore past work, the more likely research actually gets used in decisions.
Use a consistent format when logging research notes
Imagine two researchers wrap up 5 usability sessions. One rated task difficulty on a scale from 1 to 5. The other jotted "easy," "medium," or "hard." Both approaches capture something real, but try combining the findings into a single picture of where users struggled most. You can't average a 3 against "medium." Synthesis stalls before it starts.
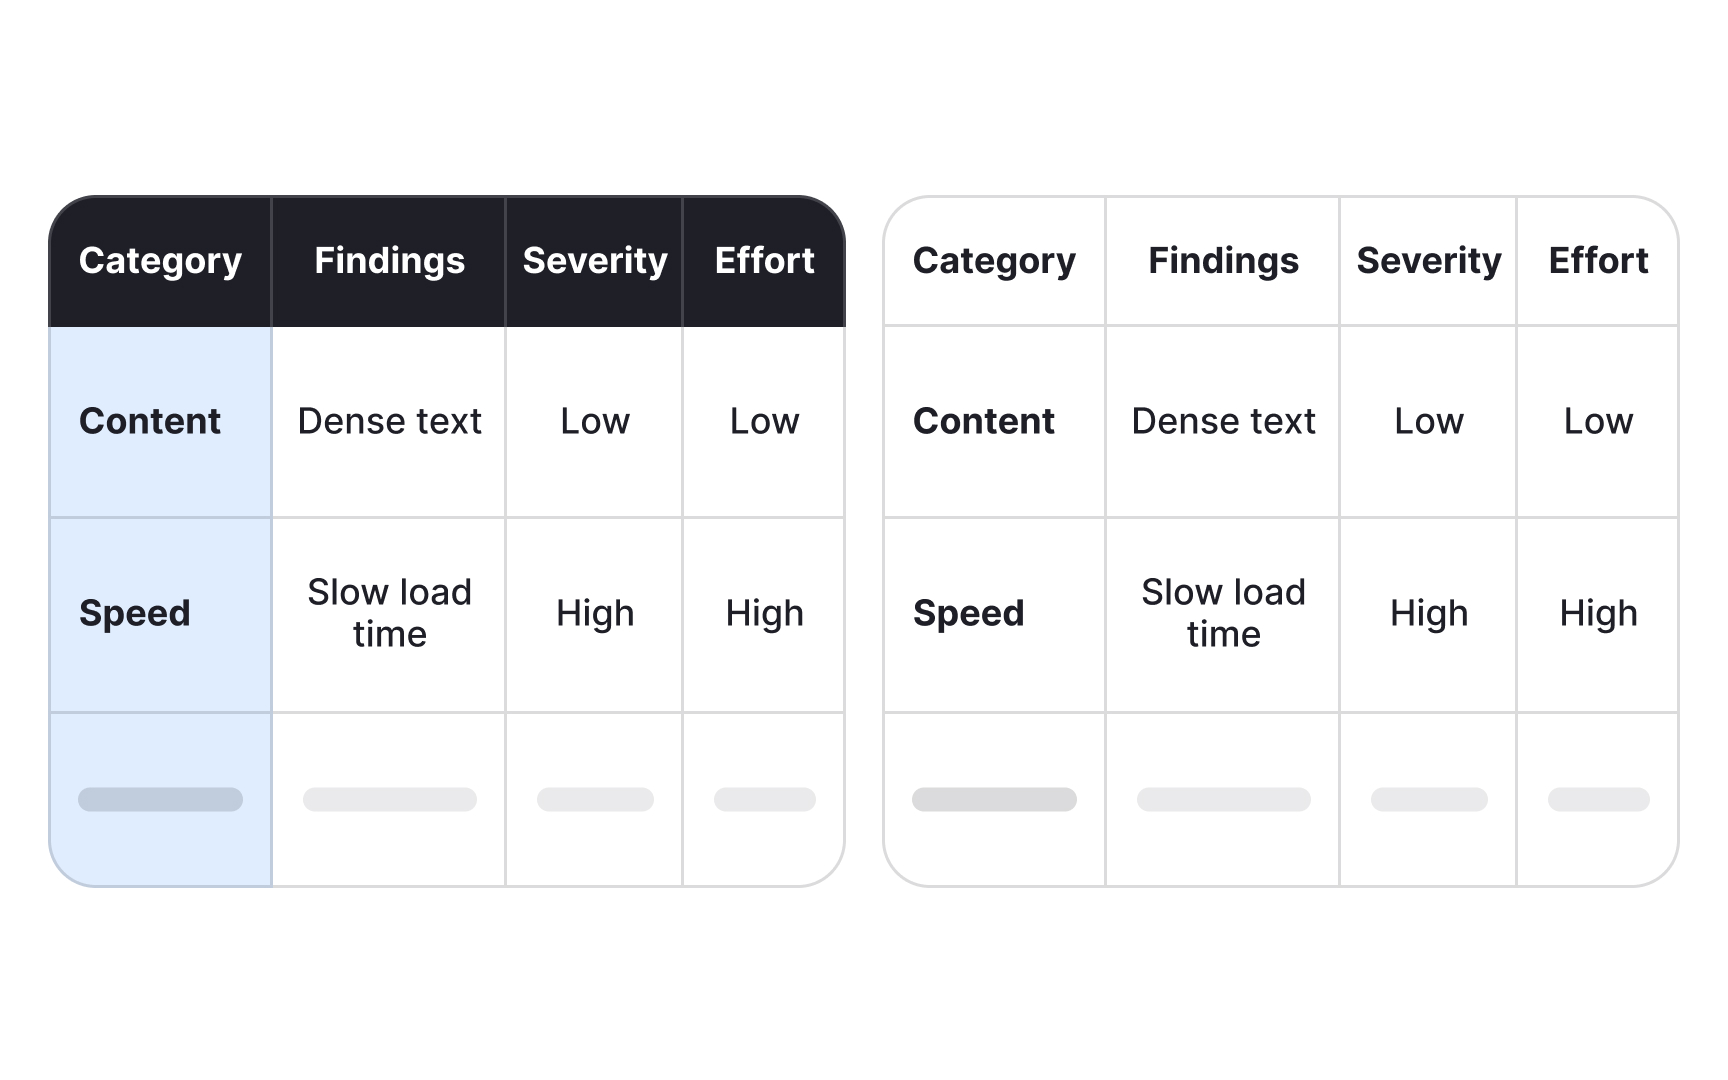
Consistency in how you record data isn't about tidiness. It's what makes cross-session comparison possible. When everyone on a team uses the same rating scale, the same tags for quotes versus interpretations, and the same color codes for themes, patterns become visible. Inconsistent formats hide them.
Whatever system you choose, severity ratings, task completion criteria, or sentiment indicators, the whole team needs to apply it the same way across every session. A short reference guide shared at the start of a project is enough to keep everyone aligned.
One habit that pays off during synthesis: mark the difference between what a participant said and what you concluded from it. Quotes in quotation marks, your own interpretations in brackets. When you return to the data weeks later, that distinction matters.
Your notes will be revisited by teammates during synthesis, by stakeholders during readouts, and by you months later when a new project touches the same problem space. The easier they are to parse, the more value they hold.[1]
Pro Tip! Document your note-taking conventions before fieldwork starts. Even a single shared page prevents the inconsistencies that are easy to miss and hard to fix during synthesis.
Organize research data as you collect it
Analysis is where most UX research projects slow down. Researchers finish their sessions and then face a wall of raw notes, transcripts, and recordings that all need to make sense together. The problem often isn't the volume of data itself. It's that none of it was organized along the way.
Leaving all organization until after data collection creates two compounding problems. First, details fade fast. Observations that felt vivid during a session lose context within days, making it harder to interpret what actually happened. Second, when everything lands in your lap at once, it's genuinely difficult to hold multiple sessions in mind while looking for patterns across them.
Organizing data after each session changes this. Labeling notes, tagging quotes, and grouping early observations into themes while the session is still fresh keeps the work manageable and the data accurate. By the time the last session wraps up, a meaningful portion of your synthesis is already done.
It also builds your research library as you go. Data organized in real time is easier to retrieve later, both for the current project and for future work that touches the same questions.
Pro Tip! Tag and label notes right after each session, not at the end of the project. Each session is easier to process alone than all sessions are together.
Use coding to identify themes in qualitative research data
After a round of user interviews or usability sessions, you're left with pages of notes, quotes, and observations. Thematic analysis turns that raw material into patterns you can act on by moving through data systematically rather than skimming for impressions.
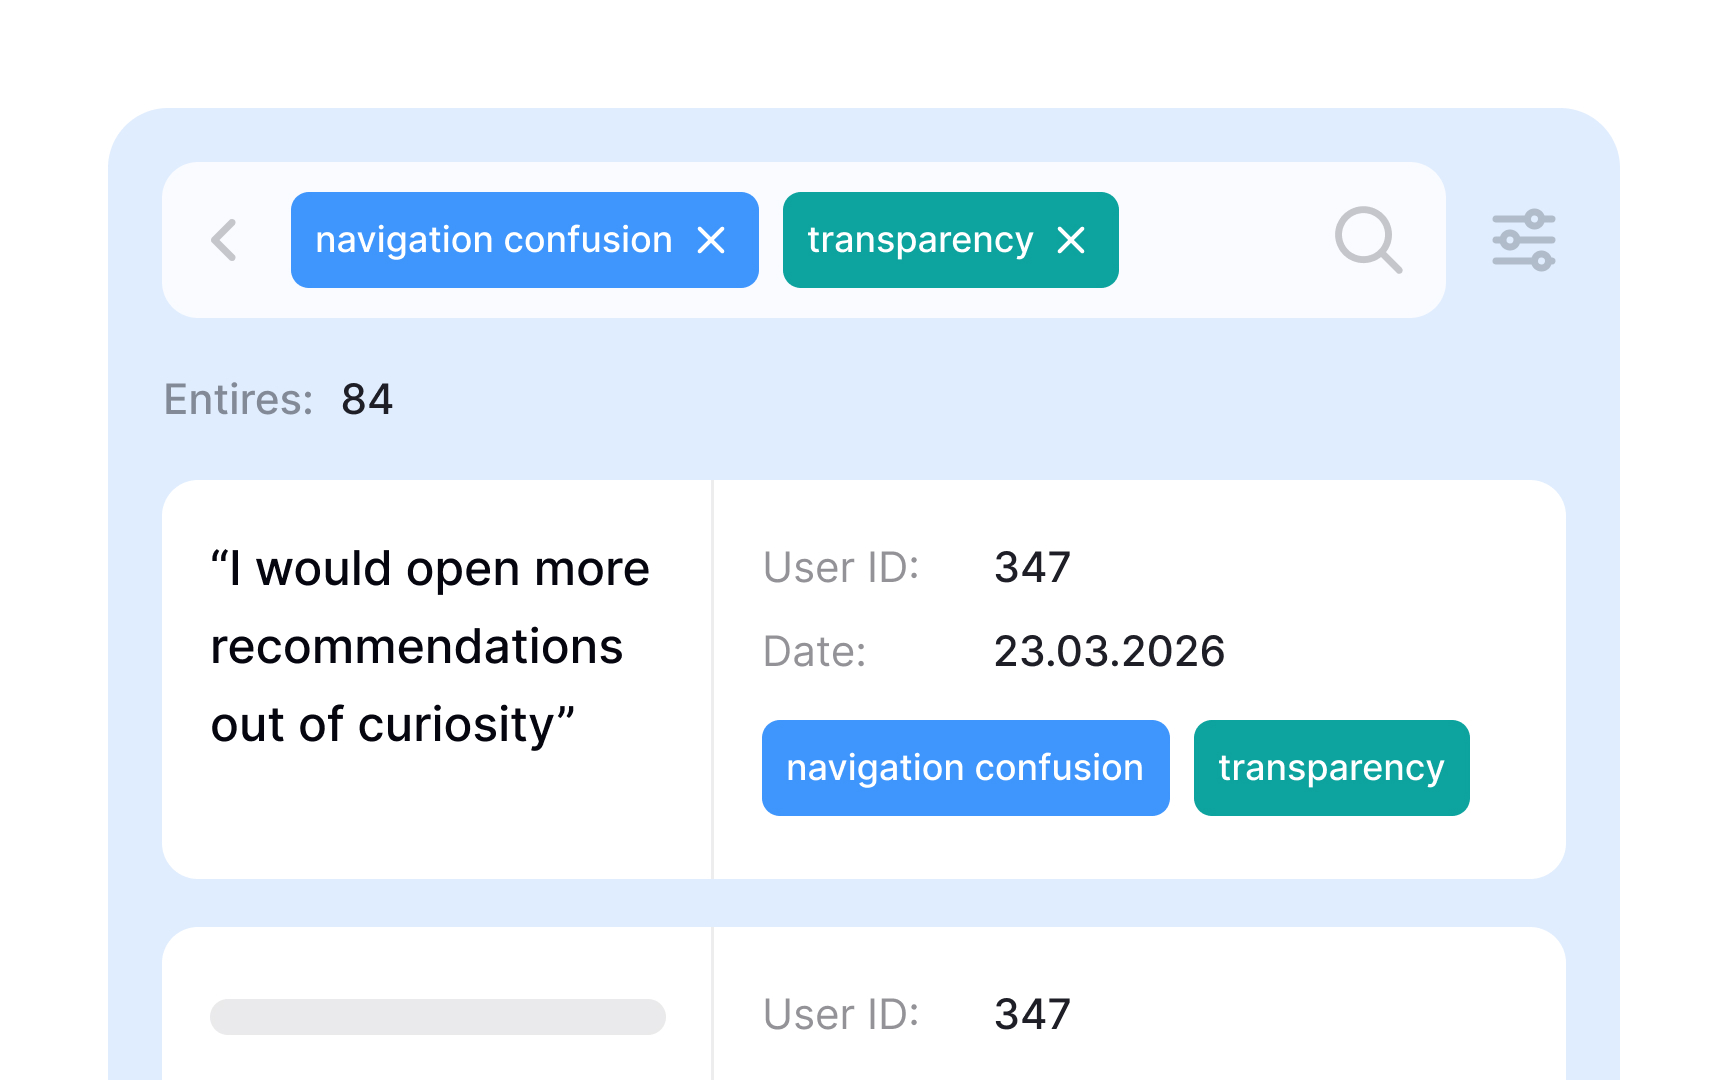
The process starts with coding. A code is a short label applied to a segment of text that describes what it's about, similar to how a hashtag describes a post. A participant quote about struggling to find the checkout button might get coded "navigation confusion." Another about unclear pricing might be coded "transparency."
Once the data is coded, theme development begins. You review all your codes and look for ones that share an underlying idea, then group them together. Codes like "can't find checkout," "wrong section," and "missed navigation link" might all collapse into a single theme: navigation confusion. A theme only holds weight when the same pattern appears across multiple participants, not just once.
Thematic analysis works best with qualitative data from interviews, focus groups, and diary studies. It can be done manually with spreadsheets or sticky notes, or with dedicated research tools that support tagging and grouping at scale.[2]
Use affinity mapping to find patterns across research sessions
After a round of user interviews or usability sessions, you have raw material: quotes, observations, and notes scattered across transcripts and session files. Affinity mapping turns that pile into something your team can actually use. It's a synthesis method that groups related data points together so patterns in user behavior, pain points, and needs become visible rather than buried.
The process works bottom-up. Instead of starting with categories and sorting data into them, you let the groupings emerge from the data itself. This matters because it reduces confirmation bias: you're less likely to find only what you expected to find.
To build an affinity map, perform the following steps:
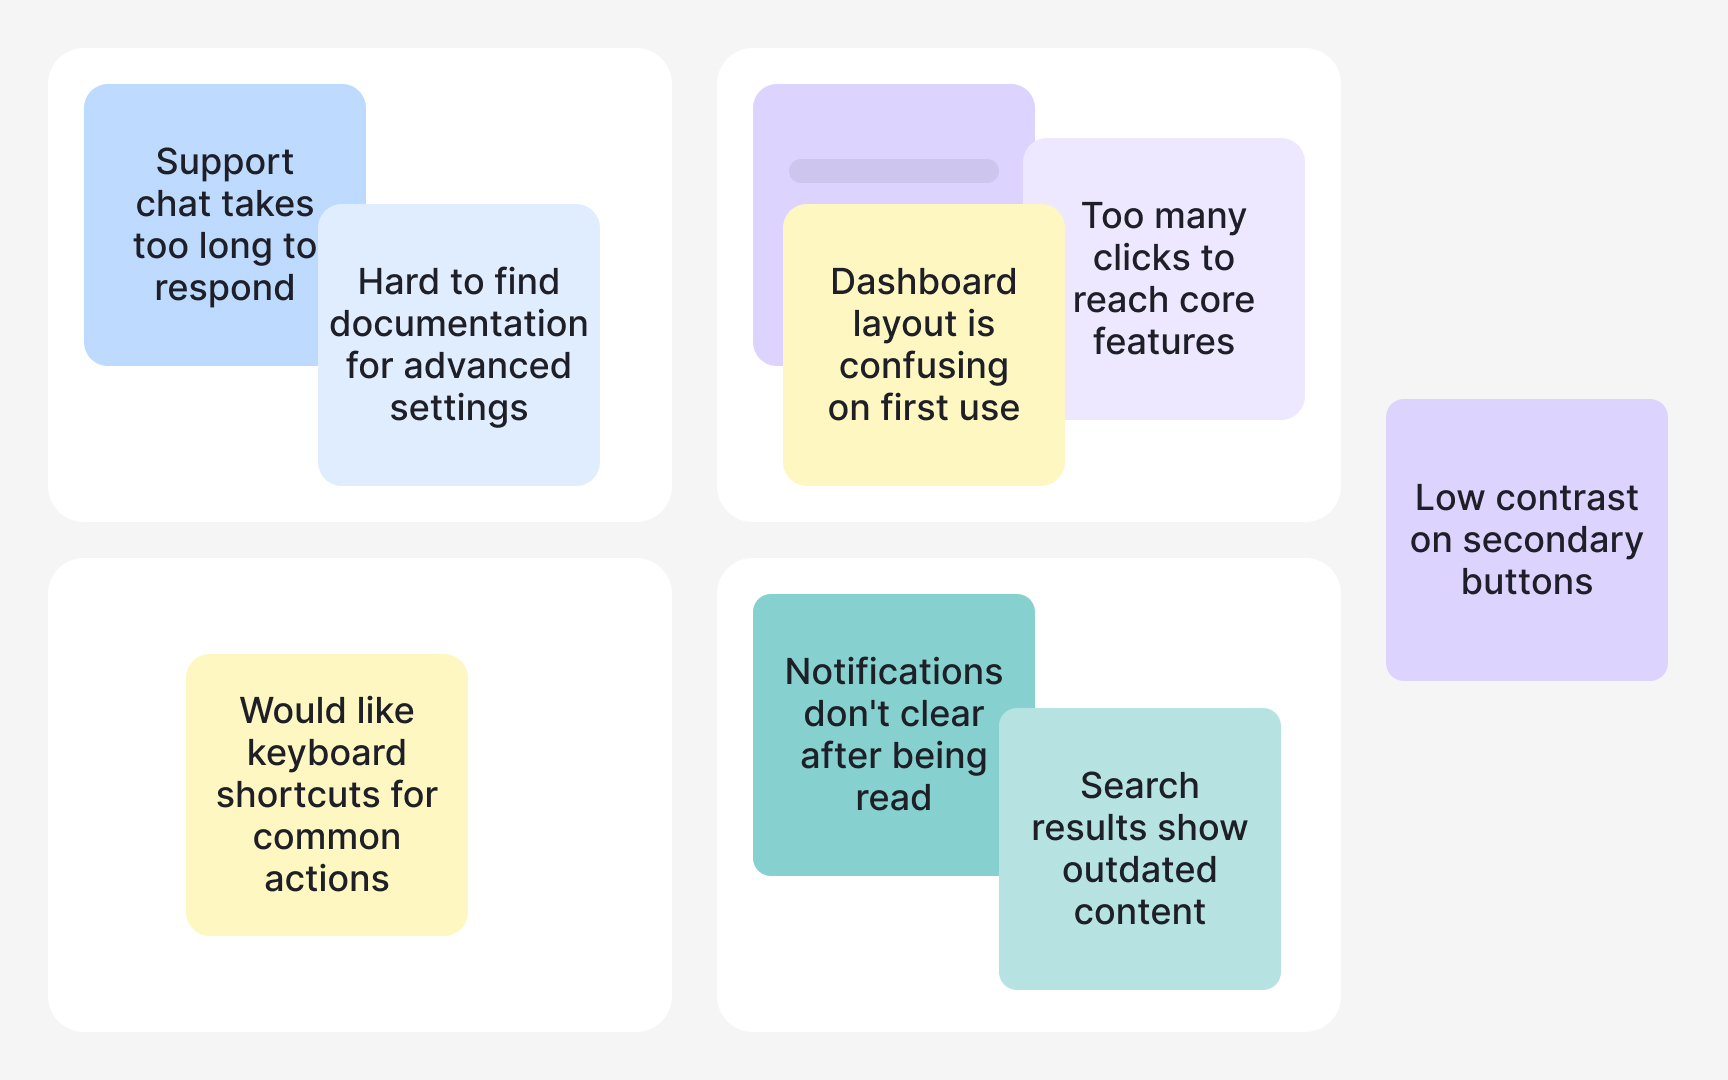
- Write each observation, quote, or data point on a separate card or sticky note, one idea per card.
- Then look for cards that share something in common and move them together.
- As clusters form, give each one a name that describes what the group represents. Those cluster names become your themes: recurring patterns that show up across multiple participants, not just in one session.
- Finally, document what each cluster tells you about user needs or problems.
Affinity mapping works well with data from interviews, usability tests, and diary studies. It can be done on a physical wall with sticky notes or in digital tools like Miro or FigJam, which also make it easier to share findings with stakeholders.[3]
Pro Tip! One idea per card is the rule that makes affinity mapping work. Mixed notes are hard to move and even harder to cluster accurately.
Set a file naming convention before collecting research data
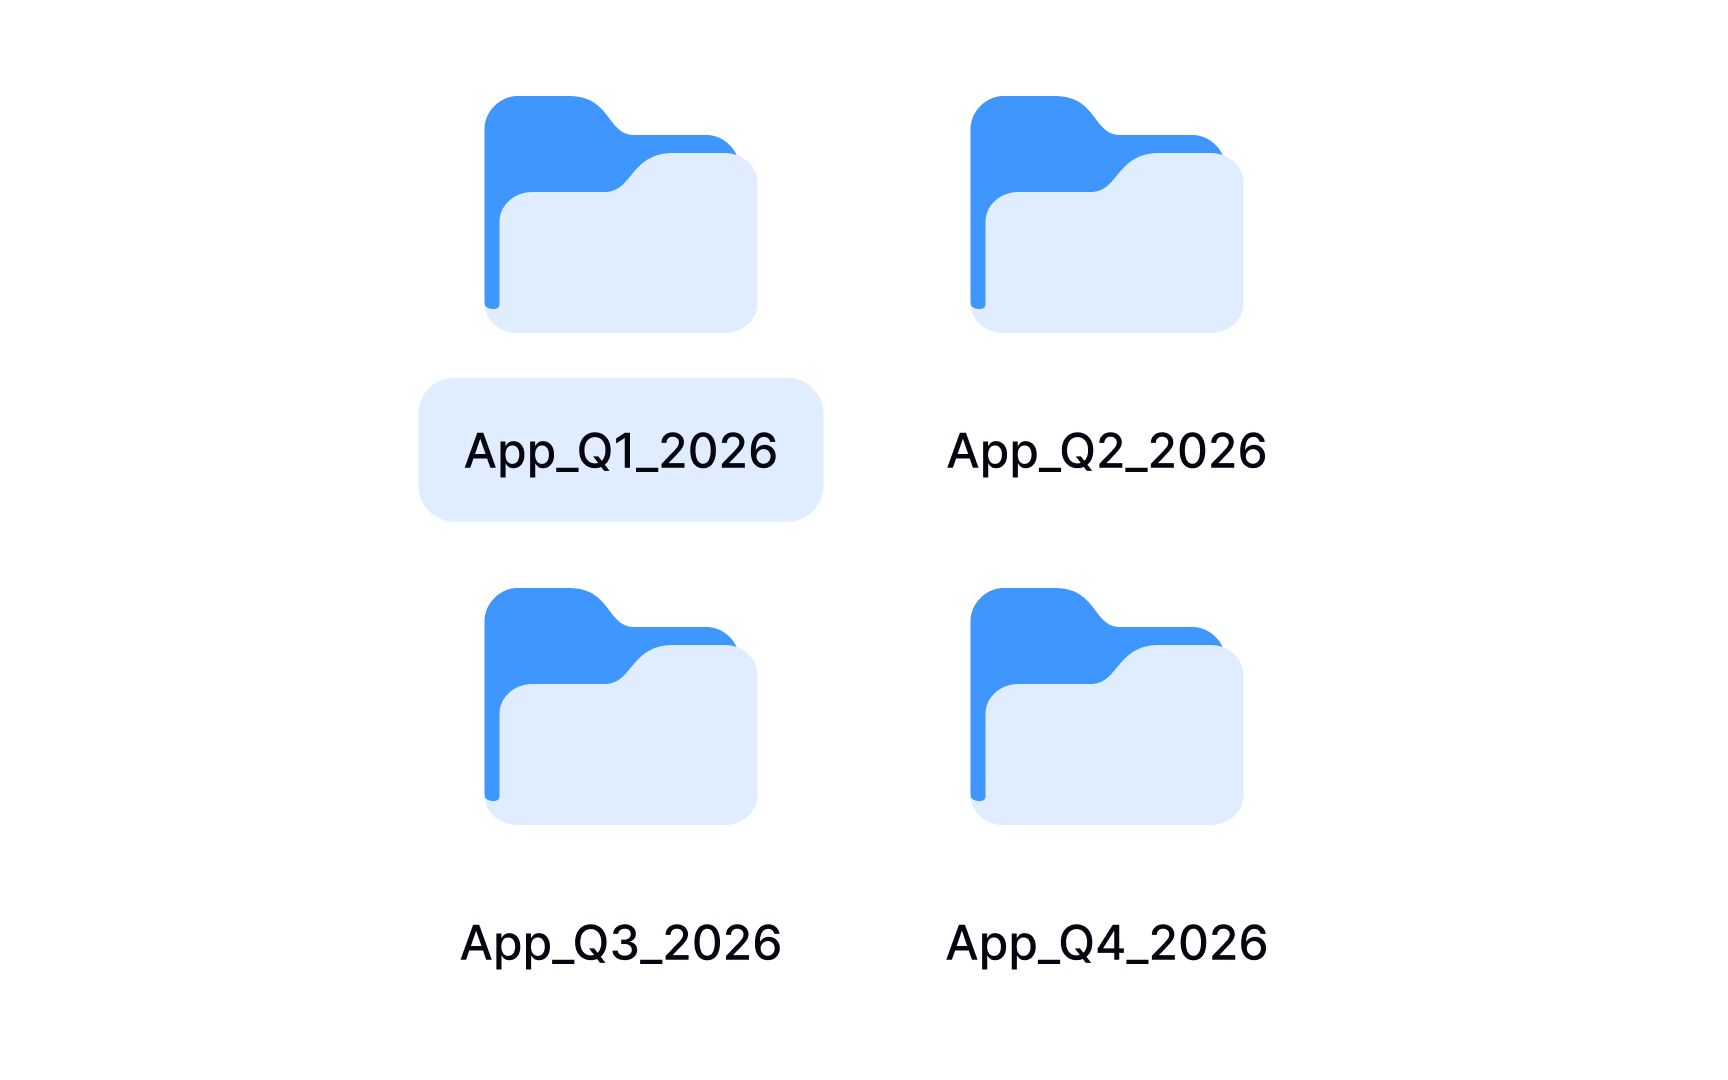
A search for "interview_final" returns 3 files. One is from last month, one from six months ago, and one nobody can date. That's a common outcome when a team starts a research project without agreeing on how to name files.
A file naming convention is a shared framework that describes what each file contains just from its title. Good file names typically include:
- Project name
- Session date in a consistent format like YYYYMMDD
- Participant number
- Version indicator such as v01 or v02.
For example, a file named checkout-flow_20240315_P04_v01 tells anyone on the team exactly what the file contains without opening it.
The convention matters most on collaborative projects. One researcher using hyphens, another using underscores, and a third adding spaces creates separate naming patterns that a search won't reconcile. Files get missed, duplicated, or overwritten.
The fix is simple: agree on the convention before data collection starts, write it down in a short shared document, and make it accessible to everyone on the team throughout the project. Establishing it after files already exist means renaming everything retroactively, which is time-consuming and error-prone.
Identify key insights from your research findings
Organized themes are not insights yet. A theme tells you what came up repeatedly. An insight tells you what it means and why it matters.
The distinction is important. "Users mentioned difficulty with navigation" is a finding. "Users abandon checkout because they can't locate the back button after an error state" is an insight. One describes a pattern. The other explains the underlying cause and points toward a decision.
Key insights are the answers to your original research questions. To find them, go back to your research goals and ask: what does each theme actually reveal about user behavior, needs, or mental models? The answer, supported by evidence from your data, is an insight.
In practice, insights emerge by looking for what multiple participants share in terms of motivation, not just action. If 5 users skipped a feature, that's a finding. If all 5 skipped it because they assumed it required a paid account, that's an insight. The shared motivation is the thing worth acting on.
When writing an insight, aim for 3 components:
- What you observed
- Why it's happening based on your data
- What it means for the product or experience
Keeping all 3 together makes each insight self-contained and usable when you share findings with stakeholders weeks or months later.
Insights don't always confirm what your team expected to find. The ones that challenge assumptions are often the most valuable ones.
Pro Tip! If an insight doesn't point toward a decision, it's probably still a finding. Ask "so what?" until you reach something actionable. That's usually where the real insight lives.
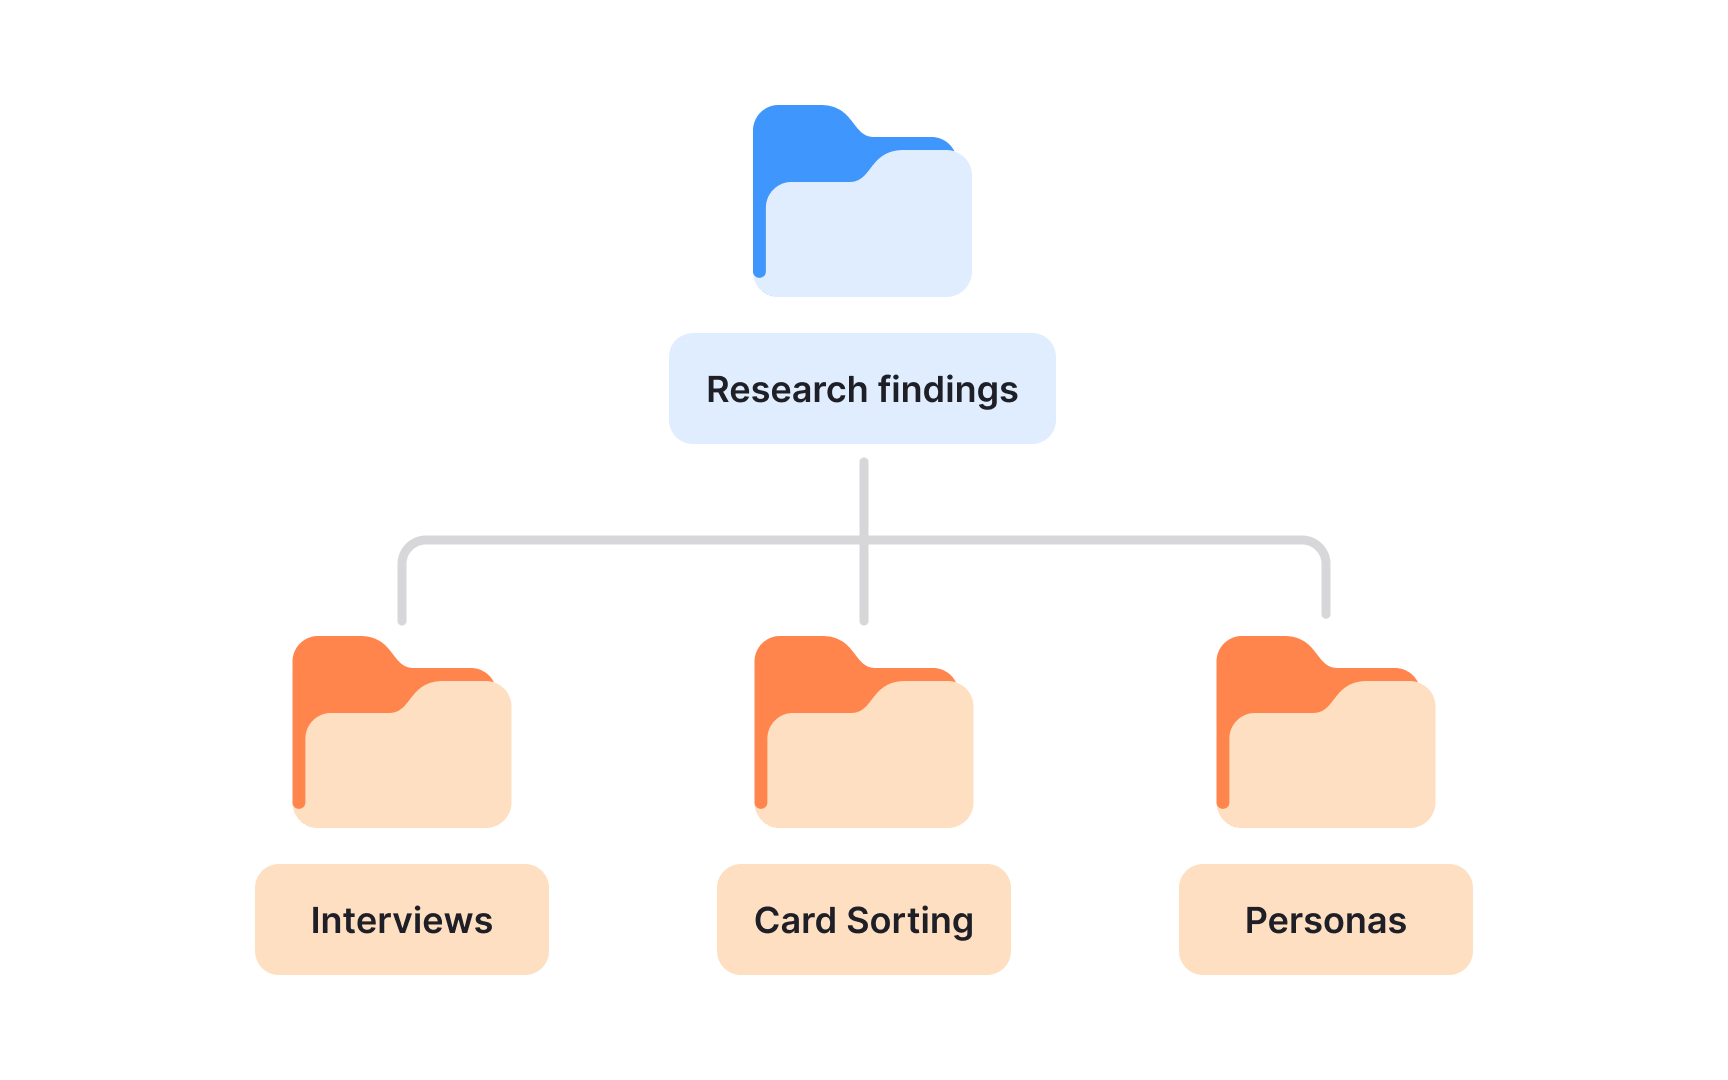
Build a user research repository to preserve and reuse insights
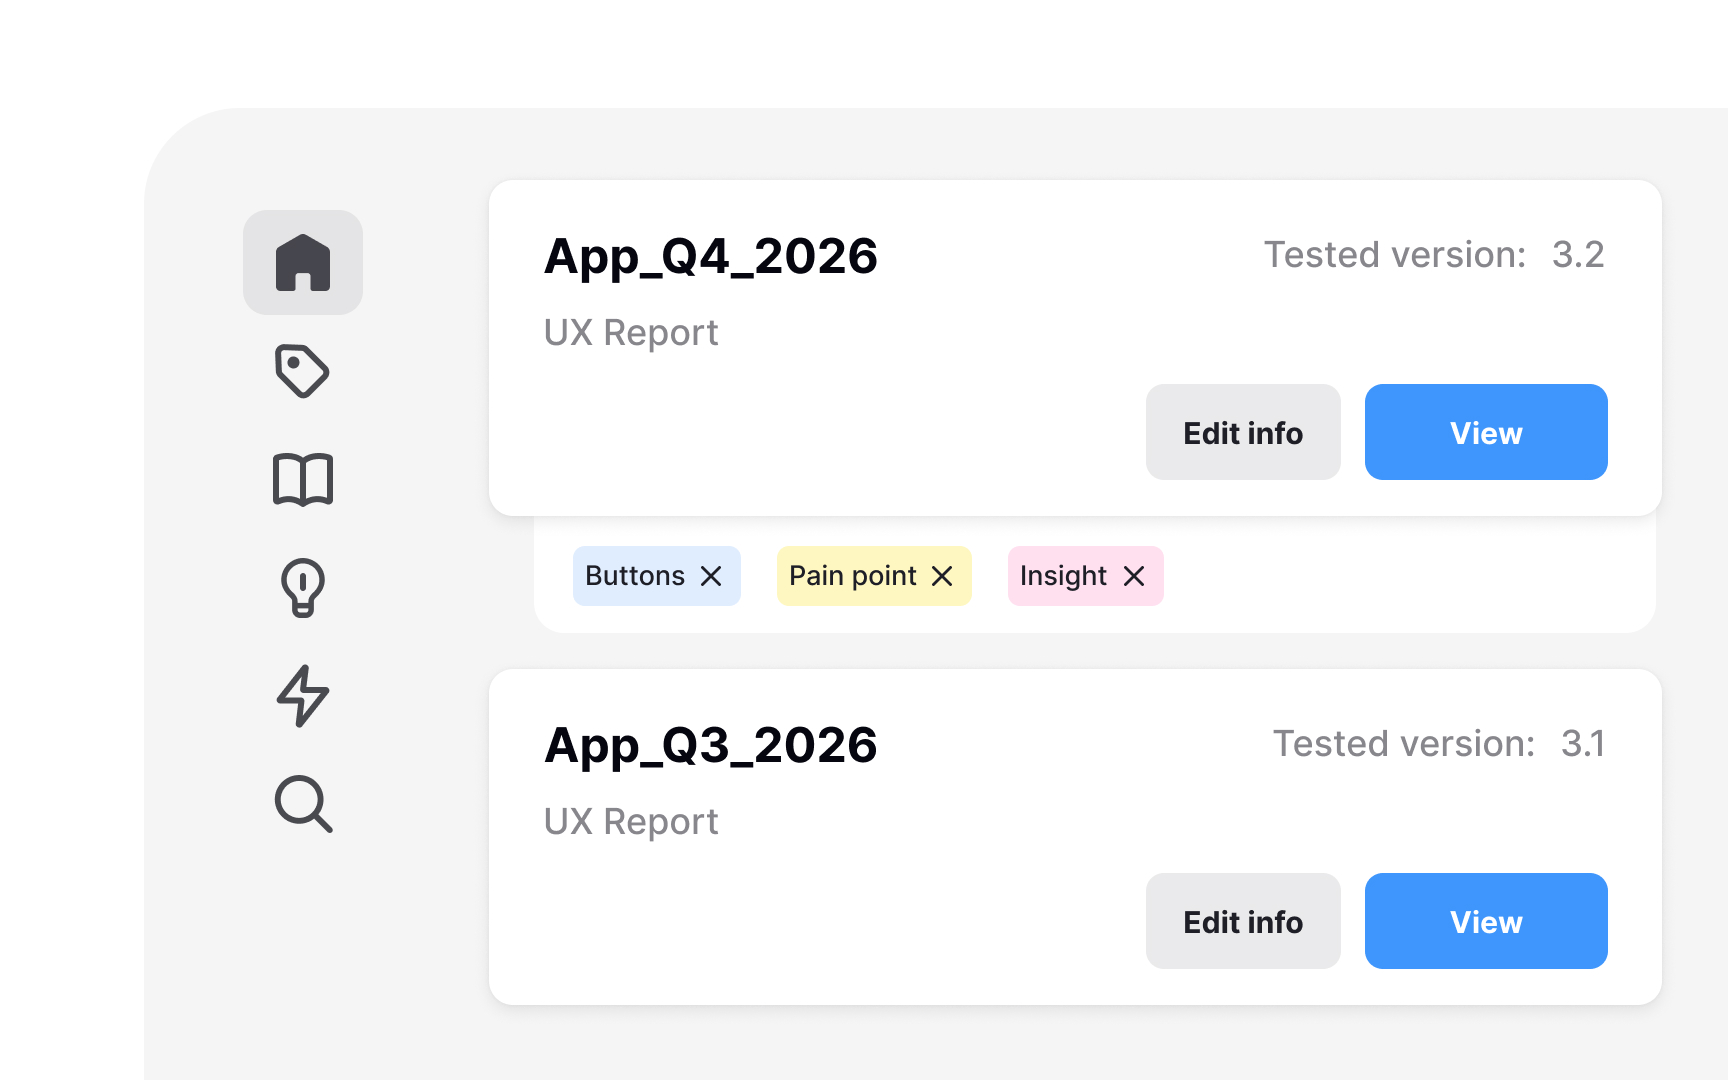
Without a central place for research data, insights end up in scattered folders and personal drives. Teams often run the same study they ran a year ago, not because the answer doesn't exist, but because nobody can find it. A repository solves this.
A research repository is a centralized knowledge base for all research materials.
It stores inputs like research plans and guides, raw outputs like transcripts and notes, synthesized outputs like insights and recommendations, and records of decisions made from the data.
This matters because research reports are summaries. They cut detail in the interest of readability. A repository preserves what reports leave out: the full quote that clarifies an insight, the edge case one person mentioned. That raw material is valuable when a related question comes up later.
Repositories help teams spot patterns across studies. One usability test might surface a navigation issue. Three studies pointing to the same problem is a signal worth escalating. Without a shared record, that pattern stays invisible.
Tools like Notion, Airtable, and Dovetail are common choices. What matters most is consistency: a repository only works if every study gets added and every insight gets tagged.[4]
Pro Tip! Set up the repository before your first study. Retrofitting an unorganized archive is far more time-consuming than starting with structure.